Entity Investigator dashboards
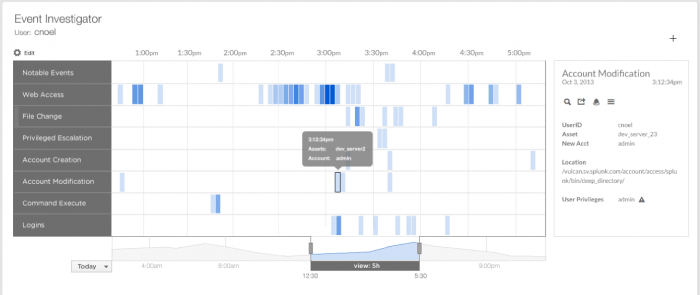
The Entity Investigator dashboards show types of notable events displayed by swim lanes over time, with heat maps to indicate the number for each type of notable event.
- swim lanes
- time picker
- heat map
Use the section below the main panel to select a type of notable event and zoom in on the details, changing the time span and granularity.
Asset Investigator
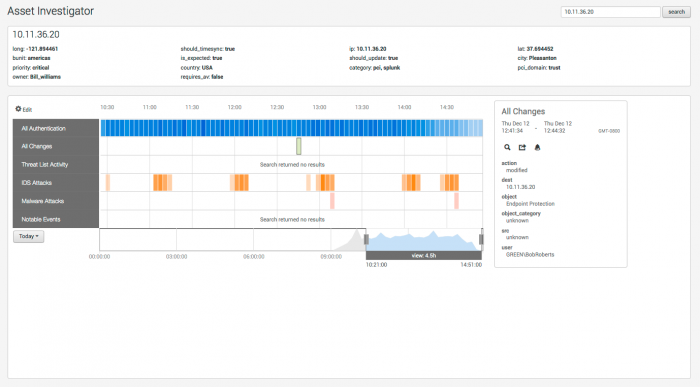
The Asset Investigator dashboard shows information about a particular asset in several different areas. The information panel describes the asset that is displayed.
Click "Today" to select a different time span or drag the edges of the time bar to change the time range for the view.
The following table describes the swimlanes for this dashboard.
| Swimlane | Description |
|---|---|
| All Authentication | |
| All Changes | |
| Threat List Activity | |
| IDS Attacks | |
| Malware Attacks | |
| Notable Events |
Identity Investigator
The Identity Investigator dashboard shows information about a particular identity in several different areas. The information panel provides information about the identity that is displayed.
Click "Today" to select a different time span or drag the edges of the time bar to change the time range for the view.
The following table describes the swimlanes for this dashboard.
| Swimlane | Description |
|---|---|
| All Authentication | |
| All Changes | |
| Threat List Activity | |
| IDS Attacks | |
| Malware Attacks | |
| Notable Events |
Edit the swim lanes
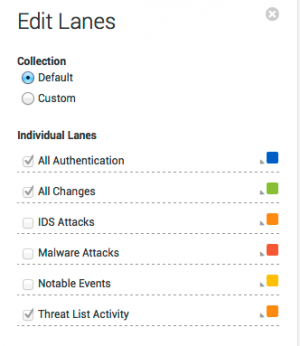
You can modify the swim lanes displayed in the Identity Investigator dashboard. Click Edit at the top of the dashboard. The swim lane editor can be used to change the group of swim lanes (default or custom), the order of the lanes, or the color used to represent events for that lane.
- Choose default or custom collection of lanes
- Choose order of lanes
- Choose color to represent events for that lane
| Predictive Analytics dashboard | Risk Analysis |
This documentation applies to the following versions of Splunk® Enterprise Security: 3.1, 3.1.1, 3.2


 Download manual
Feedback submitted, thanks!