Incident Review
The Incident Review dashboard displays notable events and their current status. As an analyst, you can use the dashboard to gain insight into the severity of events occurring within your system or network. You can use the dashboard to triage new notable events, assign events to analysts for review, and examine notable event details for investigative leads.
Notable events
Splunk Enterprise Security uses correlation searches to automate the review of events for security relevant incidents, and to detect patterns in your data. When a suspicious pattern is detected, the correlation search creates an alert called a notable event. For more information, see "Notable Events" in this manual.
A notable event represents one or more anomalous incidents that a correlation search has detected across data sources. For example, a notable event can represent:
- The repeated occurrence of an abnormal spike in network usage over a period of time
- A single occurrence of unauthorized access to a system
- A host communicating with a server on a known threat list
The Incident Review dashboard surfaces all notable events, and categorizes them by potential severity so you can quickly triage, assign, and track issues.
Use the Incident Review dashboard
Use this dashboard as part of your incident triage workflow. You can monitor notable events and the actions that analysts take to resolve the issues that triggered a notable event.
Incident review workflow
An example workflow for performing incident review.
- An administrative analyst monitors the Incident Review dashboard, sorting and performing high-level triaging on newly created notable events.
- When a notable event warrants investigation, the administrative analyst assigns the event to a reviewing analyst to initiate the event’s journey through the resolution workflow.
- The reviewing analyst changes the status of the event from New to In Progress, and begins investigating the cause of the notable event.
- The reviewing analyst researches and collects information on the event using the fields and field actions that are presented in the notable event. The analyst records the details of their research in the Comments field of the notable event.
- After the reviewing analyst is satisfied that the conditions of the notable event have been addressed, with any remediation tasks escalated or solved, the notable event’s status is set to Resolved. The notable event is reassigned to a final analyst for verification.
- The final analyst reviews and validates the changes made to resolve the issue, and sets the status to Closed.
Splunk Enterprise Security maintains an audit log of all incident review activity, visible on the "Incident Review Audit" dashboard.
Triage notable events
The Incident Review dashboard offers several tools to facilitate the task of triaging notable events, including search filters, tagging, and sorting. Use the search filters and time range selector to focus on groups of, or an individual notable event. A notable event provides the metadata fields Urgency, Status, and Owner to assist in categorizing, tracking, and assigning events.

| Filter by | Description | Action |
|---|---|---|
| Urgency | Filter by the Urgency of the notable events | Table: select to filter out |
| Status | Filter by the workflow status of the notable events | Multi-select: Click inside the field to expose a selection menu. Choose an item to filter in. Repeat to add multiple Status filters. |
| Owner | Filter by the workflow owner of the notable events | Multi-select: Click inside the field to expose a selection menu. Choose an item to filter in. Repeat to add multiple Owner filters. |
| Security Domain | Filter by the security domain of the notable events | Multi-select: Click inside the field to expose a selection menu. Choose an item to filter in. Repeat to add multiple Security Domain filters. |
| Tag | Filter notable events by tag | Multi-item: Click inside the field and type the tag name to filter on. Repeat to add multiple Tag filters. |
| Name | Filter by string | Text field. Wildcard with an asterisk (*) |
| Search | Filter with search language queries, and accepts some notable event fields. Example: comment="*exfiltration*" | Text field. Wildcard with an asterisk (*) |
| Time | Select a time range to filter results | Drop-down: select to set time-range |
Notable Event Urgency
The urgency of a notable event is calculated using the severity of the correlation search event and the priority of the asset or identity on which the event occurred. For more information about how urgency is calculated, see "How the urgency of an event is assigned" in this manual.
Urgency levels for notable events are:
- Low
- Medium
- Informational
- High
- Critical
By default, security analysts can change the urgency of a notable event. To remove this ability, see "Configure Incident Review Settings" in this manual.
Notable Event Status
A new notable event is created with a status of New. As a notable event moves through the incident review workflow, the event owner can update the status of the notable event to reflect the actions they take to address the event.
- Unassigned: The event has not been assigned an owner
- New (default): The event has not been reviewed
- In Progress: An owner is investigating the event
- Pending: An event closure is pending some action
- Resolved: The resolution action is complete, and awaiting verification by another user
- Closed: The event resolution is verified
You can customize the notable event status names and workflow progression. For more information, see "Notable Events Statuses" in this manual.
Notable Event Owner
The owner of an event is the analyst currently reviewing or taking action to resolve an event. Owner options for notable events are:
- Unassigned (default)
- Administrator
- esadmin
- esanalyst
For more information about user roles and Enterprise Security capabilities, see "Configure user and roles" in the Installation and Upgrade Manual.
Tagging notable events
You can tag the notable events displayed on the Incident Review dashboard for additional identification and to simplify searching. Key notable event fields such as Title, Status, and Owner offer the option to create new tags through the field action menu labeled Edit Tags.
Once tags are created, use the dashboard Tag filter to find tagged events by entering the tag name.

Sorting notable events
Use the header row arrows to sort notable events.

Assigning notable events
When a subset of notable events is ready for assignment, use the selection box to choose the notable events to be assigned.

In the Edit Events window, update the Owner field to assign the notable events to an analyst.

Notify an analyst
You can use a correlation search to notify an analyst if a notable event has not been triaged.
- Under Configure > Content Management, locate the Untriaged Notable Events correlation search using the filters.
- Modify the search, changing the notable event owner or status fields as desired.
- Set the desired alert action.
- Save the changes.
- Enable the Untriaged Notable Events correlation search.
Add to an investigation
While triaging notable events, you can create an investigation timeline to investigate several related notable events further.
- Select one or several notable events, then click Add to Investigation.
- A dialog box will appear. Select Create new investigation, then add a title (required) and a description (optional) for your new investigation.
- Click Save to add the selected events to the investigation.
- Clicking Cancel will create a new investigation without adding the selected notable events.
See Investigation Timelines in this manual for more about this feature.
Work with notable events
An analyst tasked with reviewing and investigating a notable event will prioritize the list of events assigned to them.

Use the information arrow on the left to expand an event and show additional fields:

- Correlation Search: A link to the Edit Correlation Search page where the correlation search associated with the event is defined. Review the correlation search parameters to understand why the notable event was created.
- History: A window displays the notable event history by date. To view event updates in sequence, use the Previous and Next links. The View all recent activity for this Notable Event link displays all the change history for that notable event in a separate search window.
- Contributing Events: A search link to a drilldown search. The events that triggered the notable event creation will be displayed. The drilldown defaults to All Time. To change the drilldown time range, see "Configure Correlation Searches" in the this manual.
- Original Event: The full details of the original event that created the notable event.
A drilldown on notable events finds more events than are displayed on the Notable Event dashboard. By default, notable event drilldown is configured to display all related events when you drill down. You can change this setting by editing the associated correlation search.
Expanding or managing notable events in Incident Review
If your search did not complete or is running in real time, you might not be able to expand or manage notable events. Searches in the Incident Review dashboard must be finalized before working with notable events. To finalize a search, click the green checkmark icon. For more information, see "Perform search actions" in the Splunk Enterprise Search Manual.
The Actions menu offers additional workflow actions for events. Different actions are defined for events, and fields in events.
Event Actions
Event actions are designed to identify workflows for indexed events. The notable event suppression and sharing notable event actions are provided to assist an incident review workflow.

- Add Event to Investigation: Allows you to add the notable event to an attack or investigation timeline. Select an Investigation or create a new one. See Investigation Timelines in this manual.
- Share Notable Event: Presents a Share Event dialog box with a hyperlink to the notable event.
- Suppress Notable Events: Creates a New Notable Event Suppression to suppress additional notable events of the same type from a host. See "Create a suppression from Incident Review" in this manual.
Field Actions
Field actions are designed to identify workflows for fields. There are many field actions enabled, and the availability of actions vary by field type. Fields such as host, src, src_ip, dest, and dest_ip have the most field actions available.

Examples of field actions:
- Access Search (as destination): Opens the Access Search dashboard, takes the field value and refines the search using that field value as the destination.
- Asset Investigator: Opens the Asset Investigator dashboard, takes the field value and refines the search using that field value.
Updating event statuses
After you take action on an event, update the status to the next stage of the incident review workflow.
- Use the checkboxes to select one or more events, then select Edit all selected. To take action on all displayed events, click Edit all ## matching events.
- The Edit Events window appears. Update the fields to reflect your actions.
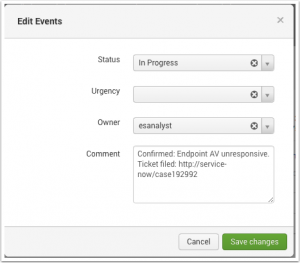
- Add an optional Comment to describe the actions taken. Comments are optional by default, but incident review settings can be configured to require comments when updating a notable event. See "Configure Incident Review Settings" in this manual.
- Save changes. If your changes are not immediately visible, check the Incident Review dashboard filters. For example, if the filter is set to "new" after you changed an event to "In Progress", your updated event will not display.
- Repeat until the event investigation is complete. When complete, change the Status field to Resolved.

Configure Incident Review Settings
You can make changes to the Incident Review dashboard in Configure > Incident Management > Incident Review Settings. Use the Incident Review Settings to change the columns displayed on the dashboard and the event fields displayed for a notable event. You can also configure whether analysts can override the calculated urgency of a notable event, and choose whether to require an analyst to add a comment when making changes to a notable event.
- Allow Overriding of Urgency: Allows analysts to override and replace the calculated urgency of a notable event. It is enabled by default.
- Comments: Choose whether to require comments, and set a minimum length for required comments.
- Required: If selected, an analyst cannot edit Notable Events without providing a comment.
- Minimum Length Required: Enter the minimum character length for required comments. It defaults to a 20 character minimum.
Change columns
You can alter the columns displayed on the Incident Review dashboard. Review the existing columns in Incident Review - Table Attributes. Use the action column to edit, remove, or change the order of the available columns. You can also add custom columns by selecting Insert below or selecting More..., then Insert above.
Change notable event fields
You can alter the fields displayed for notable events. Use the action column to remove unwanted fields, or edit the name or field used.
|
PREVIOUS About Splunk Enterprise Security |
NEXT Notable events |
This documentation applies to the following versions of Splunk® Enterprise Security: 4.0.0, 4.0.1, 4.0.2, 4.0.3, 4.0.4, 4.0.5, 4.0.6
Feedback submitted, thanks!