Use analytic stories through the use case library in Splunk Enterprise Security
The Splunk security research team writes analytic stories that provide actionable guidance for detecting, analyzing, and addressing security threats. An analytic story contains the searches you need to implement the story in your own Splunk Enterprise Security (ES) environment. An analytic story also provides an explanation of what the search achieves and how to convert a search into adaptive response actions, where appropriate.
The Splunk Enterprise Security Content Update (ESCU) delivers analytic stories to customers as part of a content subscription service. Analytic stories give you advice on how to use Splunk ES to investigate and take action on new threats that Splunk ES detects in your environment.
The ESCU analytic story content is available directly in Splunk ES through the use case library. If you do not have ESCU installed, you will see one analytic story by default as well as a message prompting you to download and install the ESCU add-on for access to common security analytic stories.
Prerequisites for using the use case library include the following:
- Data is ingested via your forwarders and technical add-ons.
- The CIM add-on is installed.
- (Optional) The ESCU add-on is installed so you can access more analytic stories.
You can explore, activate, bookmark, and configure common searches in the use case library.
Determine which analytic stories to use
You can use common industry use cases to determine which analytic stories and searches are useful to you. There are a variety of ways to determine if an analytic story contains the searches you need:
- by industry use case
- by framework
- by data
In the following scenario, you know that you're interested in common AWS-related security issues, so you start by filtering on known use cases for cloud security.
- From the Splunk ES menu bar, select Configure > Content > Use Case Library.
- From the use cases filters on the left, click Cloud Security.
- From an analytic story, such as Suspicious AWS EC2 Activities, click the greater than ( >) symbol to expand the display.
- You will see the detection searches that are related to this use case.
- You will also see your data sources, data models, and lookups that these searches use.
Data Sources Description Recommended Data Sources The type of data sources that are likely to provide valuable data. Sourcetypes Your sourcetypes that are in use by the detection searches for this analytic story. If the status icon shows a red exclamation mark, hover over the icon to see the reason. Data Models Your data that is in use by the detection searches for this analytic story as mapped to the Splunk data models via the CIM add-on. If the status icon shows a red exclamation mark, hover over the icon to see the reason. Lookups Your lookups that are in use by the detection searches for this analytic story. If the status icon shows a red exclamation mark, hover over the icon to see the reason. - Click the name of the analytic story. In this case, click Suspicious AWS EC2 Activities.
The Analytic Story Details page opens for the story. - You will see the searches related to the stages of detecting, investigating, assessing, and mitigating issues.
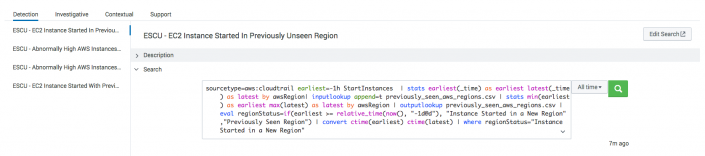
- From the Detection section, select a search, such as ESCU - EC2 Instance Started In Previously Unseen Region.
- From the Search section, click the greater than (>) symbol to expand the display.
- Revise the time picker and click Search.
- From the How to Implement section, click the greater than (>) symbol to expand the display for tips on implementation.
- From the Known False Positives section, click the greater than (>) symbol to expand the display for tips on when the results might not indicate a problem.

If you want to run this search automatically on a regular basis, see Enable and schedule the analytic story.
Enable and schedule the analytic story
Once you determine that an analytic story will help you detect, investigate, assess, or mitigate an issue, you can enable and schedule it. An analytic story is considered "in use" when at least one search is enabled and scheduled. By default, all stories are disabled. If a search is enabled but not scheduled, or if it is run manually, then it is not considered in use.
- From the Splunk ES menu bar, select Configure > Content > Use Case Library.
- From the event information column, click the greater than ( >) symbol to expand the display.
- Click the name of an ESCU detection search.
A new content management window opens. - Click Enable.
- Click the name of an ESCU detection search.
- To edit the correlation search schedule, click the name of the search.
- Click Save.
To modify correlation searches in your environment, see Create correlation searches in Splunk Enterprise Security.
Bookmark the analytic story
Bookmarks persist per user, so individual analysts can bookmark the analytic stories that are specific to their duties.
- From the Splunk ES menu bar, select Configure > Content > Use Case Library.
- Find the name of the analytic story.
- Toggle the Bookmark switch to enable it.
- From the drop-down filters, select Bookmarked > True to find your bookmarked stories.
Configure the library
You can revise how the preconfigured use case library displays your most frequently used analytic stories and searches.
The use case library does not require any special capability to view analytic stories, but it does require the edit_analyticstories capability to edit and add them. By default, ES assigns the edit_analyticstories capability to the ess_admin and ess_analyst roles. An admin can assign other roles from the Permissions setting.
Edit or add analytic story details
To edit the displayed descriptions, narratives, references, or searches:
- From the Splunk ES menu bar, select Configure > Content > Use Case Library.
- From the use case library, click the name of an analytic story to see the Analytic Story Details page, which contains all the default information that is provided by the ESCU content.
- From the top-right of the Analytic Story Details page, click Edit.
- A new browser window opens so you can change the story descriptions, narratives, or references to fit your specific usage. These changes are global, not per user, so everyone sees the same updates.
- You can also add existing searches that do not display by default in this analytic story.
- Scroll to the Searches section.
- Click Add Search.
- Select the search to include in this story.
- Click Save.
Search types
When you add a search in the Edit Analytic Stories window, the type of search appears to the right of the search name. By default you will see detection, investigative, contextual, support, or select to annotate.

Only annotated searches are associated with an analytic story. When you add an annotated search, the search is immediately added to the analytic story. In those added searches, you can click Edit Search to revise the annotations of that search.
If the search is not annotated, do the following to annotate it:
- From the right side of the search name, click Select to annotate.
- In the annotation editor, type the name of an existing search type or type the name a new search type in the Type field. This is the only mandatory field.
- (Optional) If you want analysts to see information when deciding which stories and searches to use, fill in information for Description, How to Implement, Known False Positives, Providing Technologies (also known as data sources or technology add-ons).
- (Optional) In the Annotations field, click Add row to add Framework names and their Mapping categories. These are free-form fields. You can use them for either industry-standard frameworks, such as National Institute of Standards and Technology issues for detecting and continuous monitoring of vulnerabilities (NIST + DE.CM), or you can use them for frameworks of your own.
You can find these later from the Framework Mapping filter.- From the Splunk ES menu bar, select Configure > Content > Use Case Library.
- From the drop-down filters, click Framework Mapping.
- Type the name of a Framework or scroll to find it.
- Click the check box to select a Framework. The filter is using OR logic, so the more check boxes you select, the more results you will see.
The savedsearches.conf file is used to annotate existing saved searches.
Create an analytic story
You can create your own analytic story and map it to the searches of your choice.
The use case library does not require any special capability to view analytic stories, but requires the edit_analyticstories capability to edit and create new ones. By default, ES assigns the edit_analyticstories capability to the ess_admin and ess_analyst roles. An admin can assign it to other roles from the Permissions setting.
- From the Splunk ES menu bar, select Configure > Content > Content Management.
- Click Create New Content > Analytic Story.
- Fill in the required fields to create your analytics story.
- Scroll down to the Searches field.
- From the Add Search drop-down menu, you can select any of the searches that have been annotated.
- Click Save.
Import analytic stories from other apps
While ESCU content is imported automatically, you can also import analytic stories from apps other than ESCU into the use case library.
Install the app to see the analytic stories in the use case library.
- Install the app onto the same search head as Splunk ES.
- Import the app. Depending on the name of the app, it will import automatically.
- Review the new knowledge objects to verify that the app is importing. If the analytic stories are visible in the use case library, the import is successful.
- Use the new analytic stories.
For more information about app naming conventions, see Import custom apps and add-ons to Splunk Enterprise Security.
If you do not see the new analytic stories in the use case library, it's because of one of the following reasons:
- The app import modular input runs every 60 seconds, so apps that match the naming conventions do not show up immediately.
- If the app name does not match the naming conventions for automatically importing, see Import add-ons with a different naming convention.
- If the app does not contain compatible use cases, it does not contain an
analyticstory.conffile.
|
PREVIOUS Expand Content Management searches to view dependency and usage information in Splunk Enterprise Security |
NEXT Configure general settings for Splunk Enterprise Security |
This documentation applies to the following versions of Splunk® Enterprise Security: 5.2.0
Feedback submitted, thanks!