Overview of deep dives in ITSI
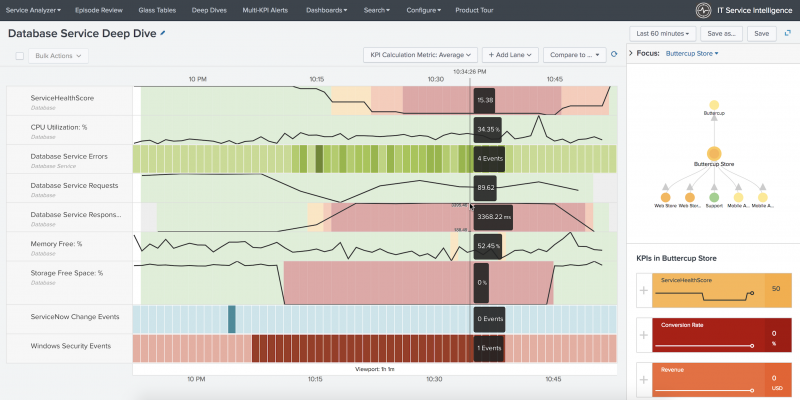
Deep dives are an investigative tool to help you identify and troubleshoot issues in your IT environment in IT Service Intelligence (ITSI). Use deep dives to view KPI search results over time, zoom-in on KPI search results, and visually correlate root cause. Stack and organize deep dive lanes to create contextual views of metrics across your services.
Deep dive searches append the timechart time series command to KPI searches to generate data in the proper format - _time column and data series column. This enables the display of search results over a user-specified time range in a swim lane graphic, and lets you see the variations in specific metrics over time.
You can use deep dives to quickly zoom in on metric and log events, and visually correlate root cause. You can create swim lanes for both KPI and ad hoc searches, and you can customize the look of your swim lanes with unique graph types and colors to differentiate services and metrics.
Create a deep dive
Create a custom deep dive view to investigate the root cause of a specific issue in your IT environment.
- From the ITSI main menu, select Deep Dives.
- Click Create Deep Dive.
- Provide a name and optional description. Select whether the deep dive will be private and only viewable by you, or shared with all users.
- Click Create.
- Open the deep dive from the deep dives lister page.
- Click Add lane to start adding metric, KPI, and event lanes to your deep dive.
Add swimlanes to a deep dive
There are several ways to add new lanes to your deep dive:
- Create new lanes using the Add Lane menu in the deep dive.
- Add KPI lanes from the topology tree sidebar within the deep dive.
- Drill down from a different ITSI dashboard, such as a service analyzer or glass table.
When you drill down to a deep dive from a different ITSI context, such as the Service Analyzer, the generated deep dive is considered an "unnamed" deep dive. If you add a new lane to it, the lane is automatically saved into the deep dive without having to click Save.
You can add the following types of KPI swimlanes to a deep dive:
| Lane type | Topic | Description |
|---|---|---|
| Metric lane | Configure metric lanes in a deep dive in ITSI | Display search results for a user-defined data model or ad hoc search. When you add a new metric lane to the deep dive, you can configure a new data model or ad hoc search. |
| KPI lane | Configure KPI lanes in a deep dive in ITSI | Display search results for existing KPIs in your services. KPI lanes also provide the option of running searches against the KPI summary index, which can accelerate search times. |
| Event lanes | Configure event lanes in a deep dive in ITSI | Display the number of occurrences of a specific event type over time. For example, an event lane might show the number of times an error appears in your data. Event lanes also let you drill down to Splunk search and view all events in a selected time bucket directly inside the deep dive.
|
Configure deep dives
You can perform the following configuration tasks within a deep dive:
| Action | Description |
|---|---|
| Configure the KPI aggregation metric | You can switch the KPI aggregation metric between average, median, maximum, and minimum to better visualize search results aggregated over the selected time range. |
| Compare search results from different time ranges | Turn on the twin-lane comparison view to compare search results from different time ranges. |
| Add entity and anomaly overlays to a deep dive | Add overlays to view more detailed information about a KPI that's not always obvious from the aggregate KPI value. |
| Create a multi-KPI alert from a deep dive | Create an alert based on correlated KPI threshold values so you can be notified the next time a similar problem occurs. |
| Create custom threshold windows in ITSI | Configure deep dive lanes in ITSI |
This documentation applies to the following versions of Splunk® IT Service Intelligence: 4.11.0, 4.11.1, 4.11.2, 4.11.3, 4.11.4, 4.11.5, 4.11.6, 4.12.0 Cloud only, 4.12.1 Cloud only, 4.12.2 Cloud only, 4.13.0, 4.13.1, 4.13.2, 4.13.3, 4.14.0 Cloud only, 4.14.1 Cloud only, 4.14.2 Cloud only, 4.15.0, 4.15.1, 4.15.2, 4.15.3, 4.16.0 Cloud only, 4.17.0, 4.17.1, 4.18.0, 4.18.1, 4.19.0, 4.19.1, 4.19.2, 4.19.3, 4.19.4, 4.20.0, 4.20.1

 Download manual
Feedback submitted, thanks!