Smart Prediction Assistant
The Smart Prediction Assistant enables machine learning outcomes for users with little to no SPL knowledge.This Assistant is built on the backbone of the Experiment Management Framework (EMF) and offers enhanced capabilities to predict the value of a categorical or numeric field based on one or more other fields in the event. The Smart Prediction Assistant provides a guided workflow that moves through stages to load data, build your model, and put that model into production. Each stage offers a data preview and visualization panel.
This Assistant leverages the AutoPrediction algorithm which persists a model using the fit command that can be used with the apply command. AutoPrediction determines the data type as categorical or numeric and then carries out the prediction. To learn more about the Smart Prediction Assistant algorithm, see AutoPrediction algorithm.
Smart Prediction Assistant Showcase
You can gain familiarity with this Assistant through the MLTK Showcase, accessed under its own tab. The Smart Prediction Showcase examples include:
- Predict Disk Utilization
- Predict the Presence of Vulnerabilities

Click the name of any Smart Prediction Showcase to see this Assistant in action using pre-loaded test data and pre-selected forecast parameters.
Smart Prediction Assistant workflow
Move through the stages of Define, Learn, Review, and Operationalize to draw in data, build your model, and put that model into production.
- Select Smart Prediction from the Experiments landing page and the Create New Experiment button in the top right.
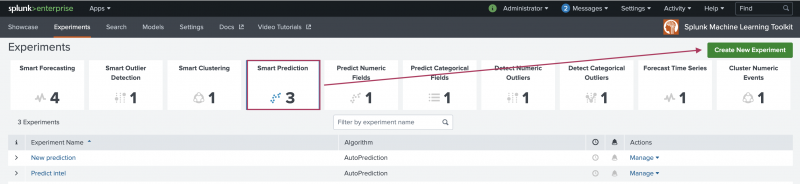
- Enter an Experiment Title, and optionally add a Description.
- Click Create to move into the Assistant interface.

Define
Use the Define stage to select and preview the data you want to use for the prediction.
- Select your data. You have three options to pull data into the Assistant and you can pull data in from anywhere in the Splunk platform:
Datasource option Description Search Use if your datasource is a stored dataset. You can use the Search bar to modify your dataset data in advance of using that data within the Learn step. Datasets Use to find any data you have ingested into Splunk, as well as any datasets that ship with Splunk Enterprise and the Machine Learning Toolkit. You can filter by type to find your preferred data faster. Metrics Use to find any metrics data you have gathered and stored as a custom index type without the need to write any SPL. This index might include data from systems including hosts, network devices, web servers, and SaaS systems. To learn more, see About the Splunk Metrics Workspace. - Once data is selected, the Data Preview and Visualization tabs populate.
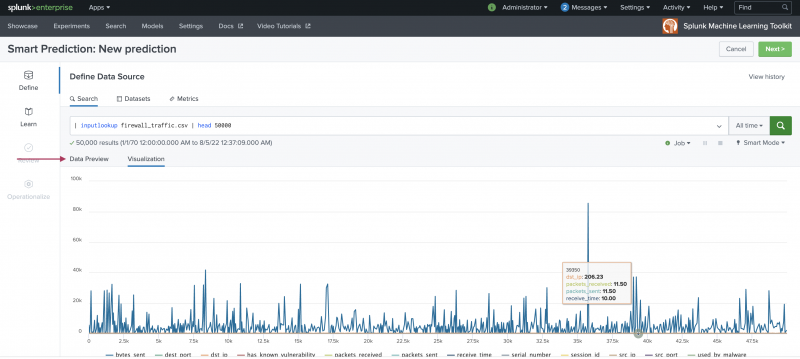
- Choose a time-range to narrow down the data time frame. The default setting of All time can be changed to suit your needs.
- When you are finished selecting your data, click Next in the top right, or Learn from the left-hand menu to move on to the next stage of the Assistant.

Learn stage
Use the Learn stage to build your prediction model. The Learn stage includes sections from which you can see the ingested data, add a preprocessing step, and select the fields that form the prediction.
- Use the +Add preprocessing step to select from one of three preprocessing algorithms.
Refer to the following table for information on the preprocessing algorithm options and the available fields for each of those algorithms.
For more detailed information on data preprocessing, see Getting your data ready for machine learning.Preprocessing algorithm Field name Field description PCA Fields to preprocess Select the fields to preprocess. Number of new fields to create Optional field. Specify the number of principal components. K new fields will be created with the prefix "PC_". KernelPCA Fields to preprocess Select the fields to preprocess. Number of new fields to create Optional field. Specify the number of principal components. K new fields will be created with the prefix "PC_". Gamma Optional field. Kernel coefficient for the rbf kernel. Tolerance Optional field. Convergence tolerance. If 0, an optimal value is chosen using arpack. Max number of iterations Optional field. If not specified, an optimal value is chosen using arpack. FieldSelector Target variable Select from list. Future variable Select from list. Type Select if data is numeric or categorical. Mode Select the feature selection mode. Options include K-best, False positive rate, False discovery rate, Family-wise error rate, and Percentile. - Choose a field to predict and one or more predictor fields from the drop-down menus generated from the ingested data. Use the slider to choose the fraction by which the data is split for training and testing. The training and testing default is 70/30.
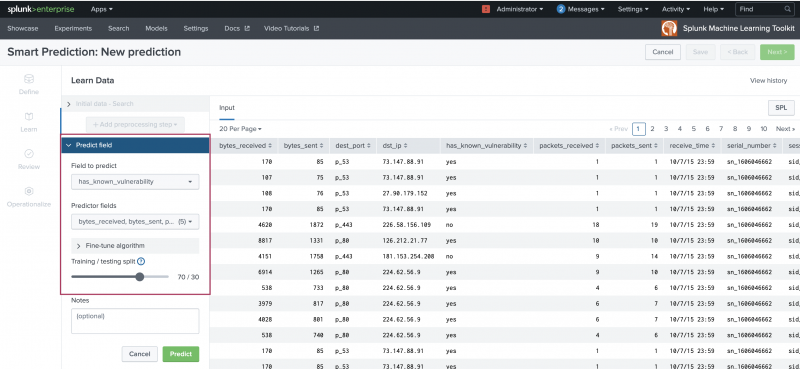
- Use the optional Notes field to track any parameter adjustments made to your Smart Prediction Experiment.
- Optionally further refine the prediction using the Fine-tune algorithm menu.
Refer to the following table for information on the available fields within the Fine-tune algorithm menu.
Field name Field description Field type Choose numeric, categorical, or auto-detect for the field to predict. Max features The number of features to consider when looking for the best split. Default to the total number of features. Criterion The function to measure the quality of a split. N estimators The number of boosting stages to perform. Gradient boosting is fairly robust to over-fitting, so a large number usually results in better performance. Max depth The maximum depth of the tree. If not set, then nodes are expanded until all leaves are pure or until all leaves contain less than min_samples_split samples. Minimum samples split The minimum number of samples required to split an internal node. Maximum leaf nodes Grow a tree with this many nodes in best-first fashion. Best nodes are defined as relative reduction in impurity. If not set, then unlimited number of leaf nodes. - Click the Predict button to generate results. The model is now in a Draft state and a summary of your selected settings appears at the top of the page. The View History option is also available. View History allows you to track any changes you make in the Learn stage.
- Review available vizualizations. All visualizations include on-screen options to change or filter the view. Hover within the visualizations to see specific data point details. Numeric data and categorical data generate different visualizations on the Evaluate tab of the Learn stage:
- Numeric data generates Statistics, Scatter Plot, and Residuals Histogram visualizations.
- Categorical data generates Statistics and Confusion Matrix visualizations. Both visualizations include on-screen options to change or filter the view. Hover within the visualizations to see specific data point details.
- The SPL button is available to review the Splunk Search Processing Language being auto-generated for you as you work through the Assistant, or to fit the SPL in a new search tab.
- When you are happy with your results, click Next in the top right, or Review from the left-hand menu to move on to the next stage of the Assistant.

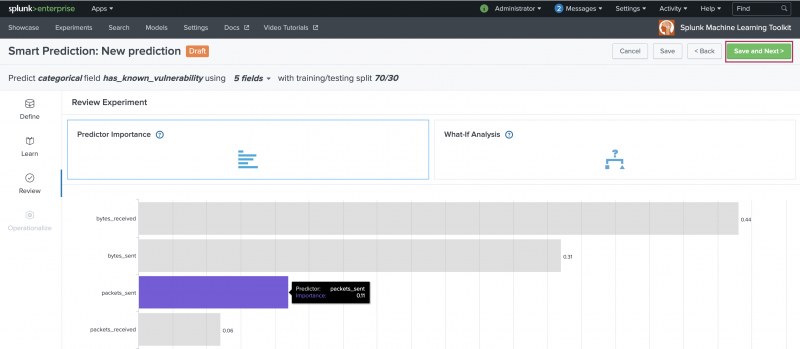
Review stage
Use the Review stage to explore the resulting model based on the fields selected at the Learn stage.
- Use the available panels as follows:
Panel name Description Predictor Importance Use the Predictor Importance panel to view a summary of the model based on selections made in the Learn stage. What-if Analysis Use the What-if Analysis to adjust field values to examine and compare different prediction model scenarios. You only see the What-if Analysis model scenario visualization after selecting a field variable and clicking the What-if button.
- Navigate back to the Learn stage to make prediction adjustments or click Save and Next to continue.
- Clicking Save and Next generates a modal window that offers the opportunity to update the Experiment name or description. When ready, click Save.

Operationalize stage
The Operationalize stage provides publishing, alerting, and scheduled training in one place. Click Done to move to the Experiments listings page.

The Experiments listing page provides a place to publish, set up alerts, and schedule training for any of your saved Experiments across all Assistant types including Smart Prediction.
Learn more
To learn about implementing analytics and data science projects using Splunk platform statistics, machine learning, and built-in and custom visualization capabilities, see the Splunk 8.0 for Analytics and Data Science course.
|
PREVIOUS Smart Clustering Assistant |
NEXT Predict Numeric Fields Experiment Assistant workflow |
This documentation applies to the following versions of Splunk® Machine Learning Toolkit: 5.3.3, 5.4.0, 5.4.1
Feedback submitted, thanks!