Alerts in the Splunk Metrics Workspace
Use alerts to monitor and respond to specific behavior in your data. Metrics Workspace alerts are based on a specific chart. Alerts use a scheduled search of chart data and trigger when search results meet specific conditions.
To create alerts in the workspace, you need specific permissions. See Hardware and software requirements for the Splunk Metrics Workspace for details.
To learn more about alerting in the Splunk platform, see Getting started with alerts in the Alerting Manual.
Parts of an alert
Alerts in the Metrics Workspace consist of alert settings, trigger conditions, and trigger actions.
Alert settings
Configure what you want to monitor in alert settings. Alert settings include:
- Alert title
- Alert description
- Permissions. Whether the alert is private or shared in the workspace.
- How often you want to check alert conditions. For example, "Evaluate every 10 minutes".
Trigger conditions
Set trigger conditions to manage when an alert triggers. Trigger conditions consist of an aggregation to measure, a threshold value, and a time period to evaluate.
For example, set trigger conditions to "Alert when Avg (over 10-second intervals) cpu.usage is greater than 10,000 in the last 20 minutes". The alert triggers when the aggregate average for cpu.usage exceeds 10,000 at any point in the last twenty minutes.
An alert does not have to trigger every time conditions are met. Throttle an alert to control how soon the next alert can trigger after an initial alert.
Trigger actions
Configure trigger actions to manage alert responses. By default, you can view detailed information for triggered alerts on the Triggered Alerts page in Splunk. To access the Triggered Alerts page, select Activity > Triggered Alerts from the top-level navigation bar.
Specify a severity level to assign a level of importance to an alert. Severity levels can help you sort or filter alerts on the Triggered Alerts page. Available severity levels include Info, Low, Medium, High, and Critical.
Create an alert
Create an alert in the Metrics Workspace to monitor your data for certain conditions.
- In the main panel, select the chart you want to use for the alert.
- Click the
 icon.
icon. - Click Save as Alert.
- Under Settings, fill in the following fields: Title, Description, Permissions, and how often to check alert conditions.
- Under Trigger Conditions, fill in the following fields: Aggregation, Threshold, evaluation window, and throttle settings.
- (Optional) Under Trigger Actions, click the + Add Actions drop-down list, and select additional actions for when the alert triggers. Triggered alerts are added to the Triggered Alerts page in the Splunk platform by default.
- Click the Severity drop-down list, and select a severity level for the alert.
- Click Save.
Manage alerts
View alerts that were previously created in the Metrics Workspace to monitor and respond to alert activity. Alerts show the same time range and hairline as other charts. Add an alert to the workspace through the Data panel. For more information, see Types of data in the Splunk Metrics Workspace.
Alert chart actions
Click the ![]() icon in the top-right corner of an alert chart to view a list of alert chart actions.
icon in the top-right corner of an alert chart to view a list of alert chart actions.
| Action | Description |
|---|---|
| Edit Alert | Modify alert conditions. |
| Search Related Events | View a list of related log events. |
| Open in Search | Show the SPL that drives the alert in the Search & Reporting App. |
Alert details
Select an alert in the Metrics Workspace to view its details. Alert details show in the Analysis panel. These details include the settings, trigger conditions, and severity level configured for the alert.
Show triggered instances to see when alert conditions are met.
- In the main panel, select the alert to show triggered instances.
- In the Analysis panel under Settings, select Show triggered instances.
Triggered instances appear as ![]() annotations on the chart.
annotations on the chart.
Triggered instance annotations appear at the end of the evaluation window in which the alert triggers, not at the time the alert threshold is crossed.
Use alert badges ![]() to gauge the alert severity level. To help you monitor alert activity, badge colors are based on the most recent severity level of a triggered alert.
to gauge the alert severity level. To help you monitor alert activity, badge colors are based on the most recent severity level of a triggered alert.
| Severity level | Badge color |
|---|---|
| No trigger | Gray |
| Info | Blue |
| Low | Green |
| Medium | Yellow |
| High | Orange |
| Critical | Red |
Example
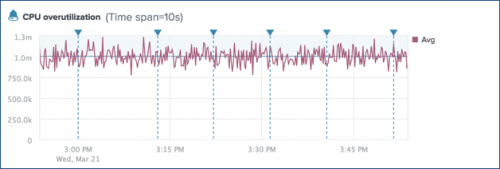
The following alert shows CPU overutilization for the system.cpu metric.
This alert is based on the aggregate average of system.cpu metric values. The blue alert badge indicates a severity level of Info. The horizontal blue line shows the alert threshold (1.0m). The ![]() annotations show triggered instances for the alert.
annotations show triggered instances for the alert.
| Analytics in the Splunk Metrics Workspace | Dashboards in the Splunk Metrics Workspace |
This documentation applies to the following versions of Splunk® Metrics Workspace (Legacy): 1.0.0, 1.0.1

 Download manual
Feedback submitted, thanks!