metadata
Description
The metadata command returns a list of sources, sourcetypes, or hosts from a specified index or distributed search peer. The metadata command returns information accumulated over time. You can view a snapshot of an index over a specific timeframe, such as the last 7 days, by using the time range picker.
See Usage.
Syntax
| metadata type=<metadata-type> [<index-specifier>]... [splunk_server=<wc-string>] [splunk_server_group=<wc-string>]...<datatype>
Required arguments
- type
- Syntax: type= hosts | sources | sourcetypes
- Description: The type of metadata to return. This must be one of the three literal strings: hosts, sources, or sourcetypes.
Optional arguments
- index-specifier
- Syntax: index=<index_name>
- Description: Specifies the index from which to return results. You can specify more than one index. Wildcard characters (*) can be used. To match non-internal indexes, use
index=*. To match internal indexes, useindex=_*. - Example:
| metadata type=hosts index=cs* index=na* index=ap* index=eu* - Default: The default index, which is usually the main index.
- splunk_server
- Syntax: splunk_server=<wc-string>
- Description: Specifies the distributed search peer from which to return results.
- If you are using Splunk Cloud Platform, omit this parameter.
- If you are using Splunk Enterprise, you can specify only one
splunk_serverargument. However, you can use a wildcard when you specify the server name to indicate multiple servers. For example, you can specifysplunk_server=peer01orsplunk_server=peer*. Uselocalto refer to the search head. - Default: All configured search peers return information
- splunk_server_group
- Syntax: splunk_server_group=<wc-string>...
- Description: Limits the results to one or more server groups. If you are using Splunk Cloud, omit this parameter. You can specify a wildcard character in the string to indicate multiple server groups.
- datatype-options
- Syntax: datatype=[metric|event]
- Description: Specifies whether to limit the search to the metrics index or the event index.
Usage
The metadata command is a report-generating command. See Command types.
Generating commands use a leading pipe character and should be the first command in a search.
Although the metadata command fetches data from all peers, any command run after it runs only on the search head.
The command shows the first, last, and most recent events that were seen for each value of the specified metadata type. For example, if you search for:
| metadata type=hosts
Your results should look something like this:
- The
firstTimefield is the timestamp for the first time that the indexer saw an event from this host. - The
lastTimefield is the timestamp for the last time that the indexer saw an event from this host. - The
recentTimefield is theindextimefor the most recent time that the index saw an event from this host. In other words, this is the time of the last update. - The
totalcountfield is the total number of events seen from this host. - The
typefield is the specified type of metadata to display. Because this search specifiestype=hosts, there is also ahostcolumn.
In most cases, when the data is streaming live, the lastTime and recentTime field values are equal. If the data is historical, however, the values might be different.
In small testing environments, the data is complete. However, in environments with large numbers of values for each category, the data might not be complete. This is intentional and allows the metadata command to operate within reasonable time and memory usage.
Real-time searches
Running the metadata command in a real-time search that returns a large number of results will very quickly consume all the available memory on the Splunk server. Use caution when you use the metadata command in real-time searches.
Time ranges
Set the time range using the Time Range Picker. You cannot use the earliest or latest time range modifiers in the search string. Time range modifiers must be set before the first piped command and generating commands in general do not allow anything to be specified before the first pipe.
If you specify a time range other than All Time for your search, the search results might not be precise. The metadata is stored as aggregate numbers for each bucket on the index. A bucket is either included or not included based on the time range you specify.
For example, you run the following search specifying a time range of Last 7 days. The time range corresponds to January 1st to January 7th.
| metadata type=sourcetypes index=ap
There is a bucket on the index that contains events from both December 31st and January 1st. The metadata from that bucket is included in the information returned from search.
Maximum results
By default, a maximum of 10,000 results are returned. This maximum is controlled by the maxresultrows setting in the [metadata] stanza In the limits.conf file.
Examples
1. Search multiple indexes
Return the metadata for indexes that represent different regions.
| metadata type=hosts index=cs* index=na* index=ap* index=eu*
2. Search for sourcetypes
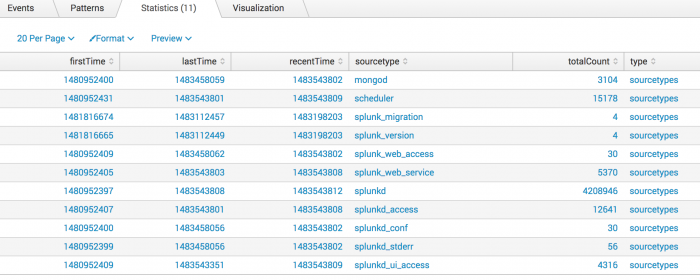
Return the values of sourcetypes for events in the _internal index.
| metadata type=sourcetypes index=_internal
This returns the following report.
3. Search for values of host
Return the values of host for data points in the mymetrics index.
| metadata type=hosts index=mymetrics datatype=metric
4. Format the results from the metadata command
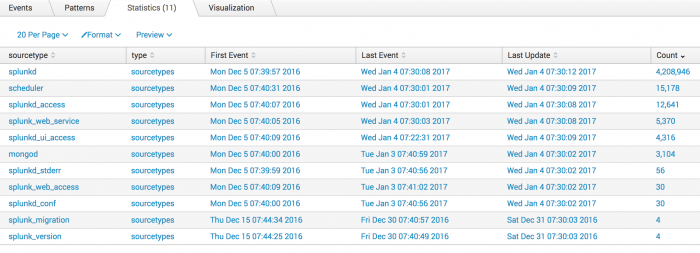
You can also use the fieldformat command to format the results of the firstTime, lastTime, and recentTime columns to be more readable.
| metadata type=sourcetypes index=_internal | rename totalCount as Count firstTime as "First Event" lastTime as "Last Event" recentTime as "Last Update" | fieldformat Count=tostring(Count, "commas") | fieldformat "First Event"=strftime('First Event', "%c") | fieldformat "Last Event"=strftime('Last Event', "%c") | fieldformat "Last Update"=strftime('Last Update', "%c")
Click on the Count field label to sort the results and show the highest count first. Now, the results are more readable:
5. Return values of "sourcetype" for events in a specific index on a specific server or wildcarded server
Return values of sourcetype for events in the _audit index on server peer01.
| metadata type=sourcetypes index=_audit splunk_server=peer01
To return values of sourcetype for events in the _audit index on any server name that begins with peer.
| metadata type=sourcetypes index=_audit splunk_server=peer*
See also
| map | metasearch |
This documentation applies to the following versions of Splunk® Enterprise: 7.0.0, 7.0.1, 7.0.2, 7.0.3, 7.0.4, 7.0.5, 7.0.6, 7.0.7, 7.0.8, 7.0.9, 7.0.10, 7.0.11, 7.0.13, 7.1.0, 7.1.1, 7.1.2, 7.1.3, 7.1.4, 7.1.5, 7.1.6, 7.1.7, 7.1.8, 7.1.9, 7.1.10, 7.2.0, 7.2.1, 7.2.2, 7.2.3, 7.2.4, 7.2.5, 7.2.6, 7.2.7, 7.2.8, 7.2.9, 7.2.10, 7.3.0, 7.3.1, 7.3.2, 7.3.3, 7.3.4, 7.3.5, 7.3.6, 7.3.7, 7.3.8, 7.3.9, 8.0.0, 8.0.1, 8.0.2, 8.0.3, 8.0.4, 8.0.5, 8.0.6, 8.0.7, 8.0.8, 8.0.9, 8.0.10, 8.1.0, 8.1.1, 8.1.2, 8.1.3, 8.1.4, 8.1.5, 8.1.6, 8.1.7, 8.1.8, 8.1.9, 8.1.10, 8.1.11, 8.1.12, 8.1.13, 8.1.14, 8.2.0, 8.2.1, 8.2.2, 8.2.3, 8.2.4, 8.2.5, 8.2.6, 8.2.7, 8.2.8, 8.2.9, 8.2.10, 8.2.11, 8.2.12, 9.0.0, 9.0.1, 9.0.2, 9.0.3, 9.0.4, 9.0.5, 9.0.6, 9.0.7, 9.0.8, 9.0.9, 9.0.10, 9.1.0, 9.1.1, 9.1.2, 9.1.3, 9.1.4, 9.1.5, 9.1.6, 9.1.7, 9.1.8, 9.1.9, 9.2.0, 9.2.1, 9.2.2, 9.2.3, 9.2.4, 9.2.5, 9.2.6, 9.3.0, 9.3.1, 9.3.2, 9.3.3, 9.3.4, 9.4.0, 9.4.1, 9.4.2


 Download manual
Feedback submitted, thanks!