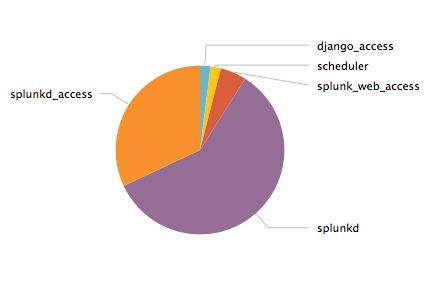

The Chart view displays any series of data you want to plot in any of the following configurable chart types:
Name | Default value | Description |
| id | Required. The unique ID for this control. | |
| charting.* | Splunk JSChart library properties. For a list of charting properties, see the Chart Configuration Reference. Note that the properties for Flash-only charts are not supported. | |
| data | "preview" | The type of data to retrieve from the search results ( results | preview | events ). |
| drilldown | "all" | Indicates whether drilldown is enabled. Possible values are "all" to enable drilldown, or "none" to disable it. |
| drilldownRedirect | true | Indicates whether to redirect to a search page when clicked. When true, a refined search corresponding to the point that was clicked is displayed in the search app. When false, you must create a click event handler to define a drilldown action. You can also use the preventDefault method in the click event handler to bypass the default redirect to search. |
| height | 250 "250px" | Height of the chart, in pixels. Can be a Number or a String. |
| managerid | null | The ID of the search manager to bind this control to. |
| resizable | false | Indicates whether the view can be resized. |
| type | "column" | The type of chart to create ( area | bar | bubble | column | fillerGauge | line | markerGauge | pie | radialGauge| scatter ). |
| settings | The properties of the view. See the methods below to get and set values. |
Note: When setting properties for a ChartElement wrapper, you might need to prepend "charting" to the property name, for example "charting.drilldown".
Name | Description |
| render | Draws the control to the screen. Called only when you create the view manually. |
| settings.get( property ) | Returns the value of property for the current component. |
| settings.set( property, value ) | Sets the value of property to the specified value for the current component. |
Name | Description |
| click:chart | Fired when the chart is clicked. |
| click:legend | Fired when the legend is clicked. |
require([
    "splunkjs/mvc/chartview",
    "splunkjs/mvc/simplexml/ready!"
], function(ChartView) {

    // Instantiate components
    var barchart = new ChartView({
        id: "example-chart",
        managerid: "example-search",
        type: "bar",
        "charting.chart.stackMode": "stacked", // Place complex property names within quotes
        "charting.legend.placement": "bottom",
        el: $("#mybarchart")
    }).render();

    // Respond to a click event
    barchart.on("click:chart", function (e) {
        e.preventDefault(); // Prevent redirecting to the Search app
        console.log("Clicked chart: ", e); // Print event info to the console
    });

});