Visualization Reference
The Splunk platform has many options for search result visualizations. Beyond a straightforward events list, you can visualize your data in tables and charts. When your search returns a single discrete number, you can visualize that result with gauge and single value displays.
Visualizations have specific data structure requirements. You can create a search that returns data in different structures depending on how you want to see your results. For example, use a transforming command (such as stats
, timechart
, or top
) to return search results in a data structure supporting tables and charts.
Accessing visualization definition features
Splunk software provides user interface tools to create and modify visualizations. You can access these tools from various places in Splunk Web.
- Search
- Dashboards
- Dashboard Editor
- Pivot
- Reports
You can also create and modify visualizations directly in simple XML code.
Visualizations from Search
You can modify how search results display in the Search page. After running a search, select the Visualization tab, then select the type of visualization to display. You can specify formatting options for the selected visualization. The search must be a reporting search that returns results that can be formatted as a visualization.
Edit visualizations provides details for editing visualizations in the Dashboard Editor. The instructions for the Dashboard Editor also apply to visualizations from the Search page.
Dashboard panel visualizations
When you base a new dashboard panel on search results you can choose the visualization that best represents the data returned by the search. You can then use the Visualization Editor to fine-tune the way the panel visualization displays.
To create a dashboard panel from search results, after you run the search click Save As > Dashboard Panel. For more information about creating and editing dashboards, see the About the Dashboard Editor and Edit visualizations.
Dashboard Editor
You can create and edit visualizations with the Dashboard Editor, an interactive visual editor. For more information, see About the Dashboard Editor.
Events visualizations
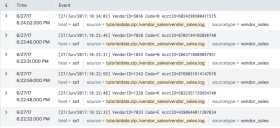
Events visualizations are essentially raw lists of events.
You get events visualizations from any search that does not include a transform operation, such as a search that uses reporting commands like stats
, chart
, timechart
, top
, or rare
. For example, a search for a set of terms and field values returns a list of events:
error OR failed OR severe OR ( sourcetype=access_* ( 404 OR 500 OR 503 ) )
If you add a transforming command to the search, you get statistical results that you can present either as a table or a chart:
error OR failed OR severe OR ( sourcetype=access_* ( 404 OR 500 OR 503 ) ) | stats count by host
With event listing visualizations, you can:
- Determine the number of events listed.
- Determine whether numbers appear to the left of each event.
- Have event text wrap to fit within the dashboard panel.
Tables
You can generate table visualizations from just about any search. However, searches that include transform operations, such as stats
, chart
, and timechart
, generate more interesting tables.
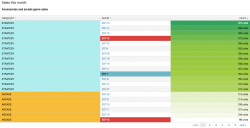
The following example shows a table for a hypothetical flower company. The table tracks price differences between its products and those of its hypothetical competitor. The following search generates data for the table:
sourcetype=access_* | stats values(product_name) as product by price, flowersrus_price | eval difference = price - flowersrus_price | table product, difference
The cells in the difference column display shades of color. The table uses a heat map for a data overlay. The high values are red while the low values are blue. In this example, products that have a higher price than the competitor are shades of red, while products that are less expensive are shades of blue.
For table visualizations you can do the following:
- Set the number of table rows to display.
- Display row numbers.
- Add data overlays that provide additional visual information, such as heat maps or high/low value indicators.
If you are formatting tables in dashboards with the Visualization Editor you can configure drilldown functionality. You can enable drilldown by row or by cell, or disable drilldown for the table entirely. See Understand basic table and chart drilldown actions in this manual.
Sparklines in tables
You can configure table visualizations to display sparklines. Sparklines show hidden patterns in data that might otherwise be hard to identify in table results. They can increase the usefulness and overall information density of tables in reports and dashboards.
To use sparklines, the underlying search has to use the stats
or chart
transforming commands. You add the sparklines
function of those commands to add a sparkline column to the table. See Add Sparklines to your search results in the Search Manual.
The following sparkline example runs off of the following search, which looks at USGS earthquake data. You can download a current CSV file from the USGS Earthquake Feeds and add it as an input, but the field names and format can differ from the example shown here. In this case, the data shows all magnitude 2.5+ quakes recorded over a given 7-day period, worldwide:
source=usgs | stats sparkline(avg(Magnitude),6h) as magnitude_trend, count, avg(Magnitude) by Region | sort count
The search displays the top 10 regions according to the total count of quakes experienced per region over that period. The sparkline in the resulting table illustrates the trend in earthquake magnitude over the course of that week for each of the top earthquake regions. The example also demonstrates how you can mouse over a sparkline to read values at specific points along its length.
Charts
Splunk software provides a variety of chart visualizations, such as column, line, area, scatter, and pie charts. These visualizations require transforming searches whose results involve one or more series.
A series is a sequence of related data points that can be plotted on a chart. For example, each line plotted on a line chart represents an individual series. You can design transforming searches that produce a single series, or you can set them up so the results provide data for multiple series.
Consider a table that a transforming search generates. Each column in the table after the first column represents a different series. A "single series" search produces a table with only two columns, while a "multiple series" search produces a table with three or more columns.
If you enable multi-series mode for line, bar, area, and column charts, you can also select independent Y-axis ranges for each series. This option can help you compare spikes or trends across multiple series. Once you select a line, bar, column, or area chart, select Format > General to enable Multi-series Mode. Then, select the Y-Axis formatting panel to enable the Independent axis range.
- Note: Enabling independent y-axis ranges is only available in multi-series mode.
All chart visualizations can display single-series searches. However the bar, column, line, and pie chart visualizations usually display the data best. Pie charts can only display data from single series searches.
If a search produces multiple series, bar, column, line, area, and scatter chart visualizations display the data best.
See Data structure requirements for visualizations in this manual for more information.
Column and bar charts
Use a column chart or bar chart to compare the frequency of values of fields in your data. In a column chart, the x-axis values are typically field values. If the search uses the timechart
transforming command, the x-axis represents time. The y-axis can be any other field value, count of values, or statistical calculation of a field value. Column charts and bar charts represent data similarly, except that the x-axis and y-axis values are reversed. For more information, see the Data structure requirements for visualizations in this manual.
The following bar chart presents the results of a search that uses internal metrics. It calculates the sum of CPU seconds by processor in the last 15 minutes. It then arranges the processors with the top ten sums in descending order. This example also shows how you can mouse over a single bar or column to get detailed information.
The following search drives the bar chart visualization.
index=_internal "group=pipeline" | stats sum(cpu_seconds) as totalCPUSeconds by processor | sort 10 totalCPUSeconds desc
For column and bar chart visualizations, you can do the following:
- Set the chart titles, as well as the titles of the x-axis and y-axis.
- Set the minimum y-axis values.
- Set the unit scale to logarithmic values
Logarithmic values are useful with a mix of very small and very large y-axis values. See Edit visualizations in this manual for more information.
- Configure charts as stacked, 100% stacked, and unstacked.
Bar and column charts are unstacked by default. See the following subsection for details on stacking bar and column charts.
- Set the major unit for the y-axis.
For example, configure tick marks in units that work best for your data.
- Determine the position of the chart legend and the manner in which the legend labels are truncated.
- Enable or disable drilldown functionality.
See Understand basic table and chart drilldown actions in this manual.
Stacked column and bar charts
When a base search involves more than one data series, you can use stacked column charts and stacked bar charts to compare the frequency of field values in your data.
Unstacked charts
In an unstacked column chart, the columns for different series appear alongside each other. An unstacked column chart is useful for relatively simple search results. But when the series count increases an unstacked column chart can appear cluttered and confusing.
Stacked charts
A stacked column chart displays all the series columns for a single data point as segments of a single column. The total value of the column is the sum of the segments. You typically use a stacked column or bar chart to highlight the relative weight, or importance, of the different types of data that make up a specific data set.
The following example illustrates the customer views of pages in a website of a hypothetical flower store. It breaks out page views by product category over a 7 day period.
The following search drives the data in the example. The usage of the fields
command in the search ensures that the chart only displays counts of events with a product category ID. It excludes events without a category ID, categorized as null
in the search results.
sourcetype=access_* method=GET | timechart count by categoryId | fields _time BOUQUETS FLOWERS GIFTS SURPRISE TEDDY
100 per cent stacked charts
A chart set to 100% stacked lets you compare data distributions within a column or bar chart by percentage of the column or bar size. Each segment of data in the column or bar represents the percentage of all the data available.
Stacked 100% is useful to better see data distributions between segments in a column or bar chart that contains a mix of very small and very large segments.
Line and area charts
You typically use line and area charts to show data trends over time. However, you can use the x-axis to represent any field value other than time. If your chart includes more than one series, a different color represents each line or area.
The following search drives the example line chart.
index=_internal | timechart count by sourcetype
Shaded areas in area charts can help emphasize quantities. The following search drives the area chart in the example:
index=_internal source=*metrics.log group=search_concurrency "system total" NOT user=* | timechart max(active_hist_searches) as "Historical Searches" max(active_realtime_searches) as "Real-time Searches"
With line and area charts, you can do the following:
- Set the chart titles, as well as the titles of the x-axis and y-axis.
- Determine how to display null y-axis values.
You can leave gaps for null datap points, connect to zero data points, or just connect to the next positive data point. If you choose to leave gaps, the chart displays markers for data points that are disconnected. In this case, they are not adjacent to other positive data points.
- Set the minimum y-axis value.
- Set the unit scale to logarithmic values
Logarithmic values are useful with a mix of very small and very large y-axis values. See Edit visualizations in this manual for more information.
- Set the major unit for the y-axis
For example, configure tick marks in units that work best for your data.
- Determine the position of the chart legend and the manner in which the legend labels are truncated.
- Enable or disable drilldown functionality.
For more information about drilldown, see Understand basic table and chart drilldown actions in this manual.
Stacked line and area charts
Stacked line and area charts are similar to stacked column and row charts. Stacked line and area charts are useful when charting several series, making it easier to see how each data series relates to the entire set of data as a whole.
The following search drives the data in the stacked area chart example. The example also illustrates mousing over a data point for detailed information.
index=_internal per_sourcetype_thruput | timechart sum(kb) by series useother=f
Pie chart
Use a pie chart to show the relationship of parts of your data to the entire set of data as a whole. The size of a slice in a pie graph shows the value of the data represented by the slice as a percentage of the sum of all values.
The following pie chart presents the views by referrer domain for a hypothetical online store for the previous day. You can get mouse over individual pie chart slices to view details.
When you define the properties of pie charts you can set the chart title. If you are formatting pie charts in dashboards with the Visualization Editor you can do the following:
- Set the chart title
- Determine the position of the chart legend.
- Enable or disable drilldown functionality.
For more information about drilldown, see Understand basic table and chart drilldown actions in this manual.
Scatter chart
Use a scatter chart, also known as scatter plot, to show trends in the relationships between discrete values of data. Generally, a scatter plot shows discrete values that do not occur at regular intervals or belong to a series. This differs from a line graph, which usually plots a regular series of points.
The following example uses USGS earthquake data to illustrate scatter charts. The data derives from a CSV file that contains data on all earthquakes recorded over the last 30 days.
The search in the example plots magnitude and depth of earthquakes for a specific three day period. The scatter points locate the place of the earthquake. The following search generates the data for the scatter chart example.
index=usgs_earthquake place="*" earliest=1408950000 latest=1409295600 | table place mag depth
For more information about the data structures that scatter charts require, see Data structure requirements for visualizations in this manual.
From a scatter chart you can do the following:
- Set the chart titles, as well as the titles of the x-axis and y-axis.
- Determine how to display null y-axis values.
You can leave gaps for null data points, connect to zero data points, or just connect to the next positive data point. If you choose to leave gaps, the chart displays markers for data points that are disconnected. In this case, they are not adjacent to other positive data points.
- Set the minimum y-axis value.
- Set the unit scale to logarithmic values
Logarithmic values are useful with a mix of very small and very large y-axis values. See Edit visualizations in this manual for more information.
- Set the major unit for the y-axis
For example, configure tick marks in units that work best for your data.
- Configure the position of the chart legend and the manner in which the legend labels are truncated.
- Enable or disable drilldown functionality.
For more information about drilldown, see Understand basic table and chart drilldown actions in this manual.
Bubble chart
A bubble chart provides a visual way to view a three dimensional series. Each point, or bubble, plots against two dimensions on the X and Y axes of the chart. The size of the bubble represents the value for the third dimension.
The following bubble chart shows earthquake data for a three day period. The X and Y axes plot the magnitude and depth of the earthquakes recorded.
The following search generates the data for the bubble chart example.
index=usgs_earthquake place="*" earliest=1408950000 latest=1409295600 | stats count by place, mag, depth
The size of the bubble represents the number of earthquakes found at the plotted values. A mouse-over of the large bubble indicates a count of 2 for that magnitude and depth. All other bubbles indicate a count of 1. The mouse-over also shows additional data from the series, indicating the place of the earthquake.
From a bubble chart you can do the following:
- Set the minimum and maximum size of a bubble.
- Set the bubble size by area or diameter of the bubble.
- Set the chart titles, as well as the titles of the x-axis and y-axis.
- Determine how to display null y-axis values.
You can leave gaps for null data points, connect to zero data points, or just connect to the next positive data point. If you choose to leave gaps, the chart displays markers for data points that are disconnected. In this case, they are not adjacent to other positive data points.
- Set the minimum y-axis value.
- Set the unit scale to logarithmic values
Logarithmic values are useful with a mix of very small and very large y-axis values. See Edit visualizations in this manual for more information.
- Set the major unit for the y-axis
For example, configure tick marks in units that work best for your data.
- Configure the position of the chart legend and the manner in which the legend labels are truncated.
- Enable or disable drilldown functionality.
For more information about drilldown, see Understand basic table and chart drilldown actions in this manual.
Single value visualizations
About single value visualizations
Single value visualizations display results and context for searches returning a discrete number. This number can be a count or other aggregation of specific events. For instance, this visualization shows daily sales for a popular lemonade stand.
Labels and range colors add emphasis to a visualization. A trend indicator to the right of the value and a sparkline underneath show how data has changed over time.
Search for a single value
Single value visualizations work best for queries that create a time series chart using the timechart
command or aggregate data using the stats
command.
Use timechart
to generate a single value
This search and visualization use timechart
to track daily errors for a Splunk platform instance.
index=_internal source="*splunkd.log" log_level="error" | timechart count
To access sparklines and trend indicators, it is important that the search includes the timechart
command. Using timechart
means that time series data becomes available to sparkline and trend indicator processing.
- Note: If you pipe to
stats
as part of a fulltimechart
query, the visualization does not include a sparkline or trend indicator.
Use stats
to generate a single value
If you use the stats
command to generate a single value, the visualization shows the aggregated value without a trend indicator or sparkline. As an example, this query and visualization use stats
to tally all errors in a given week.
index = _internal source = "*splunkd.log" log_level = "error" | stats count
About queries and time ranges for single values
It is important to set up the single value query that best drives the visualization that you expect.
- Search for a single value to avoid unexpected results in the visualization. In the Dashboard Editor, you can select single value visualizations even if a search returns multiple values. In this case, the single value visualization uses the value in the first cell of the results table.
- The time range picker and the query command work together to generate the results for a single value visualization. A query using
stats
results in a visualization showing the aggregated total of results in the time range. A query usingtimechart
generates a visualization showing the most recent result within that range.
For more information on the data structure requirements of single value visualizations, see Data Structure Requirements for Visualizations.
For details about the stats
command, see stats in the Search Reference.
For details about the timechart
command, see timechart in the Search Reference.
Sparklines and trend indicators
A sparkline appears below a single value generated with the timechart
command. It shows increases and decreases in a metric over the time range you specify in a search.
This visualization shows results for a search over the past week's data. Using the time range picker to select Week to date means that the sparkline reflects the data changes over the last seven days.
This visualization shows results for the same search over the past day's data. Using the time range picker to select Today means that the sparkline shows data changes over the past twenty-four hours.
A trend indicator appears to the right of a single value generated with the timechart
command. It shows recent data behavior over a customizable time range. The trend indicator is composed of a number and an arrow to represent what happened most recently in the data.
Depending on data behavior, the trend arrow can point up, down, or directly to the side to show no change. By default, the trend indicator value evaluates to the difference between the two most recent values in the results. You can change the trend time window in the Format menu's General settings panel or by adjusting the span
parameter for timechart
.
- Note: To include sparklines and trend indicators in a visualization, it is important that the search includes a
timechart
command.
Customize ranges and colors for single value visualizations
Colors can emphasize range values or trends in a single value visualization. In the Format menu, you can choose whether to use colors. If you opt to use colors, you can select whether to color by value or trend.
- Note: For queries using
stats
to aggregate results, only the color by value option is available.
You can also adjust the color mode to change whether colors appear in the foreground or background.
Depending on the color mode you choose, coloring a single value generated with timechart
by value means that the sparkline and trend indicator appear black (for foreground color) or white (for background color).
Color by value
Coloring by value is available for single value visualizations generated with either stats
or timechart
. Color by value means that the single numeric value in the visualization changes color based on the value the search generates and the range for that value. For example, if you map a value range from 30-50 to the color yellow, then a single value of 35 appears yellow.
You can adjust value ranges for the query to change how different results are visualized. By default, there are five ranges and colors for coloring by value. You can add or remove ranges, modify the values for each range, and change the colors associated with each range using the Format menu.
- Note: Value ranges are inclusive of the "max" value and exclusive of the "min" value shown in the Format editor. For example, a range from 1-5 includes 5 but not 1.
As an example, this timechart
generated single value visualization shows color by value and has the background color mode selected.
Color by trend
Coloring by trend is available for single values generated with a query including the timechart
command. Coloring by trend means that the sparkline and trend indicator in this visualization change color to show changes in data. By default, positive changes make the sparkline and trend indicator appear green, while negative changes make them red. When results show no change, the trend color is black.
For example, this visualization shows color by trend and has the foreground color mode selected.
You can reverse the settings for trend colors in the Format menu. You can also specify a different trend time window for the visualization.
Using rangemap
Another option for defining ranges for a single value is to use the rangemap
command within a search.
Caution: As support for the rangemap
command is limited, it is not recommended for building new single value visualizations. Queries using rangemap
currently generate a single value, but UI configurations override the query-based settings listed below.
As an example, this search looks for errors on a Splunk platform instance.
index=_internal source="*splunkd.log" log_level="error" | timechart count as errors | rangemap field=errors low=11-25 guarded=26-50 elevated=51-99 high=100-150 severe=150-199 default=severe
By default, a single value visualization has this color mapping configuration for ranges.
low
: greenguarded
: blueelevated
: yellowhigh
: orangesevere
: red
Labels for single value visualizations
Use the Format menu's General options panel to create Before and After Labels. For instance, you can add a $ symbol before or USD after a value representing US Dollars. You can add an Under Label to show a title for the visualization.
Single value number formatting
If you are working with a large single value or one that requires precision, you can change the number formatting for the visualization. In the Format menu's Number Format panel, you can choose thousand separators or different degrees of decimal precision.
Here is an example of a visualization using three decimal place precision.
Drilldowns for single value visualizations
By default, drilldown is disabled for single value visualizations.
You can enable drilldown functionality using Simple XML. For more information about drilldowns, see Understand basic table and chart drilldown actions in this manual.
Gauges
Splunk software provides three types of gauge visualizations: radial, filler, and marker.
Gauge visualizations map a discrete number against a range of colors that may have particular business meaning or logic. Gauges use rangemaps
, as described in the single value visualization, to define color ranges. As a value changes over time, the gauge marker changes position within this range. Gauges provide an especially dynamic visualization for real-time searches, where the value returned fluctuates as events are returned, causing the gauge marker to visibly bounce back and forth within the range as you watch it.
The various gauge examples below use the same base search:
index=_internal source="*splunkd.log" log_level="error" | stats count as errors
Radial gauge
The radial gauge type looks essentially like a speedometer or pressure valve gauge. It has an arced range scale and a rotating needle. Use a range map, as described for a single value visualization, to define color ranges for the filler gauge.
The current value of the needle displays at the bottom of the gauge. In the example below, the value is 19. If the value falls below or above the specified minimum or maximum range, the needle "flutters" at the upper or lower boundary, as if it is straining to move past the limits of the range.
The following examples shows the "shiny" and "minimal" version of the radial gauge:
Filler gauge
The filler gauge is similar in appearance to a thermometer, with a liquid-like filler indicator that changes color as it rises and passes gauge range boundaries. Use a range map, as described for a single value visualization, to define the display color of the filler gauge.
By default, the filler gauge displays vertically. You can configure a horizontal display of the filler gauge.
Marker gauge
The marker gauge is a linear version of the filler gauge that is already "filled." A gauge marker rests at the value returned by the search. Use a range map, as described for a single value visualization, to define the display colors of the marker gauge.
If the gauge is displaying the results of a real-time search, the marker can appear to slide back and forth across the range as the returned value fluctuates over time. If the returned value falls outside of the upper or lower ranges of the marker gauge, the marker appears to vibrate at the upper or lower boundary, as if it is straining to move past the limits of the range.
By default, the marker gauge displays vertically. You can configure a horizontal display of the marker gauge.
Marker gauges have display issues with numbers exceeding 3 digits in length. To manage this, you can set up a search that divides a large number by a factor that reduces it to a smaller number. For example, if the value returned is typically in the tens of thousands, set your search so the result is divided by 1000. Then a result of 19,100 becomes 19.1.
You can also deal with large numbers by setting the chart configuration options to return the range as a percentage.
Configure gauge visualizations using Splunk Web
You can use the Visualization Editor to configure a gauge in a dashboard panel. The Visualization Editor lets you configure the following:
- Provide a title for the panel.
- Define the size and number of the ranges that make up the overall gauge.
For example, you could have a gauge that starts at 0, ends at 100, and is made up of four ranges that span 0-25, 26-50, 51-75, and 76-100. Or you could have a gauge that starts at 1000, ends at 3000, and is made up of several smaller ranges.
- Set the colors for each range.
By default the first three ranges are green, yellow, and red. You can customize the colors and add or subtract ranges as needed.
- Configure whether the gauge style is "shiny"' or "'minimal."
For example, the shiny version of the radial gauge models the look of a real radial machine gauge with a metallic-looking dial and black background. The minimal radial gauge is a stripped-down, "flat" version of the radial gauge design.
When you format gauge visualizations using the Visualization Editor, you can define color ranges automatically. Do this by using values defined in the search string with the gauge
command. You can customize default settings that the Visualization Editor provides.
For more information about using the Visualization Editor to format dashboard panel visualizations, see the topic Edit visualizations in this manual.
You can also define gauge visualizations using the Report Builder, the Advanced Charting view, and the results area of the Search App. These options only provide the ability to give titles to gauge visualizations. By default they create a gauge with the following three ranges:
- 1-30: green
- 31-70: yellow
- 71-100: red.
To set up different gauge ranges with these visualization definition options, update the underlying search with the gauge
search command.
Setting gauge ranges with the gauge command
You can use the search gauge
command to set custom ranges for a gauge visualization.
The gauge
command lets you set the gauge ranges using default colors. The default three colors, in order of the ranges, are green, yellow, and red. With gauge
, you indicate the field to track with the gauge. Then add "range values" to the search string to indicate the beginning and end of the range as well as the relative sizes of the color bands within it.
For example, to set up a gauge that tracks a hitcount
field value with the ranges 100-119, 120-139, 140-159, 160-179, and 180-200, add this to your search string:
...| gauge hitcount 100 120 140 160 180 200
If you do not include the gauge
command in your search or include it but fail to specify range values, the range values default to these values: 0 30 70 100
.
Maps
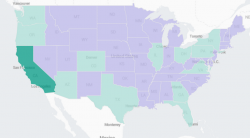
For mapping visualizations, see Mapping data.
PREVIOUS About this manual |
NEXT Data structure requirements for visualizations |
This documentation applies to the following versions of Splunk® Enterprise: 6.3.0, 6.3.1, 6.3.2, 6.3.3, 6.3.4, 6.3.5, 6.3.6, 6.3.7, 6.3.8, 6.3.9, 6.3.10, 6.3.11, 6.3.12, 6.3.13, 6.3.14
Feedback submitted, thanks!