Visualization Reference
Learn about Splunk platform data visualizations.
Events list
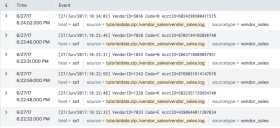
From the Search page, run a search and select the Events tab to view the events list.
Example
This search for a set of terms and field values returns an events list.
error OR failed OR severe OR ( sourcetype=access_* ( 404 OR 500 OR 503 ) )
Table
Use a transforming command in a search to generate a table. From the Search page, run the search and select the Statistics tab to view and configure the table.
Table example
This example search uses the chart
transforming command.
index = _internal | chart avg(bytes) over sourcetype
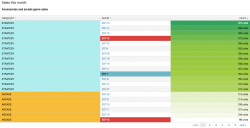
The search generates a two column table. The table includes a data overlay to highlight high and low values.
Table format options
Select the Format menu to configure a table. Configuration options include the following.
- Number of rows shown in each table page
- Add or remove table row numbers at the beginning of each row.
- Enable or disable drilldown functionality. Specify drilldown by row or cell.
- Data overlay. Choose one of the following options
- Heat map
Add different shades of a particular color to show value variation over table rows. - High and low value
Add high and low value colors to a table to highlight the highest and lowest values.
- Heat map
Table sparklines
Sparklines show data patterns or trends in a results set.
To generate a table sparkline, usestats
or chart
with the sparkline
function in a search.
Sparkline width is determined by default data binning. You can adjust data binning as a parameter of the sparkline
command.
For more information, see Add Sparklines to your search results in the Search Manual.
Chart
To build a chart, start with a transforming search that generates one or more series.
Use charts to visualize data series
A series is a sequence of related data points. These points can be plotted on a chart. For example, each line in a line chart shows one series.
Run a transforming search and select the Statistics tab. Review the statistics table to see the series generated. After the first column, each additional column represents a series. A single series search generates two columns. A multiple series search generates three or more columns.
Charts for a single data series
To optimize single series visualization, use a bar, column, line, or pie chart. Pie charts can only display single series data.
Charts for multiple data series
To optimize multiple series visualization, use a bar, column, line, area, scatter, or bubble chart.
Use multi-series mode
Multi-series mode lets you compare trends across multiple series. This mode shows independent y-axis ranges for each series. Use the Format menu General settings panel to enable multi-series mode for line, bar, area, and column charts.
See Data structure requirements for visualizations for more information.
Column and bar charts
Use column and bar charts to compare field values across a data set. Column and bar charts are similar but have opposite x-axis and y-axis fields.
Column chart
Axis | Represents |
---|---|
X (horizontal) | Represents the field values to compare. If the search includes the timechart command, the x-axis represents time. |
Y (vertical) | Any of the following
|
Bar chart
Axis | Represents |
---|---|
Y (vertical) | Represents the field values to compare. If the search includes the timechart command, the y-axis represents time. |
X (horizontal) | Any of the following
|
Example
This search calculates a CPU seconds sum for each processor. The search also sorts the processors with the ten highest sums in descending order.
index=_internal "group=pipeline" | stats sum(cpu_seconds) as totalCPUSeconds by processor | sort 10 totalCPUSeconds desc
The search generates this bar chart.
Column and bar chart format options
From the Visualization tab, select the Format menu to configure bar and column charts. Options include the following settings.
- Chart titles
- Axis titles
- Minimum and maximum y-axis values
- Use a logarithmic unit scale. This option is helpful when there are very small and very large y-axis values.
- Configure chart stacking. See the following section for more details.
- Chart legend placement and text truncation
- Label rotation
- Enable or disable drilldown.
Stacked column and bar charts
Use a stacked bar or column chart to see more details for values in a particular field. Stacked bar and column charts are available when a search generates multiple data series.
Use the Format menu to select unstacked, stacked, and 100% stacked bar and column charts. See the following comparison.
Stack option | Column or bar appearance | Use case |
---|---|---|
Unstacked | Columns or bars for different series appear next to each other. | An unstacked chart is useful for a lower number of series. As the number of series increases, the chart can become more difficult to understand. |
Stacked | Data points within a series appear as segments of a column or bar. The total column or bar value is the sum of all of the segments. | Use a stacked column or bar chart to highlight the relative volume, frequency, or importance of data points in a series. See the stacked chart example below. |
Stacked 100% | Each bar or column is divided into segments representing the distribution percentage for each data value in one series. | Use stacked 100% to show data distributions when there is significant segment size variation in each column or bar. |
Stacked column chart example
This search portion aggregates events according to code values over time. The query specifies the _time field and Code field values to include. This query generates a series for each Code field value.
...| timechart count by Code | fields _time L B N
The stacked columns show event counts for each code at different points in time. You can compare how many L, B, and N code events there were at each point in time.
Line and area charts
Use line and area charts to track value trends over time. You can also use a line or area chart x-axis to represent a field value other than time.
Each line or area in the chart represents one series. When a search generates multiple data series, each line or area appears in a different color.
Line chart example
This search tracks sourcetype frequency over time.
index=_internal | timechart count by sourcetype
The search generates multiple data series. The line chart represents each series with a different line.
Area chart example
Shading in an area chart emphasizes quantities. This example search tracks historical and real-time search volume over time.
index=_internal source=*metrics.log group=search_concurrency "system total" NOT user=* | timechart max(active_hist_searches) as "Historical Searches" max(active_realtime_searches) as "Real-time Searches"
The search generates two data series. Each series appears as a different shaded area on the chart.
Line and area chart format options
Use the Format menu to configure line and area charts. Configuration options include the following.
- Chart title
- Axis titles
- Null y-axis values. Choose one of the following options.
- Show null data points as a gap. The chart shows markers for any disconnected data points in this case.
- Connect null data points to zero data points.
- Connect to the next positive data point.
- Show minimum and maximum y-axis values.
- Use a logarithmic unit scale for y-axis values. This option is helpful when there is a wide range in y-axis values.
- Chart legend position and label truncation
- Enable or disable drilldown.
Stacked area charts
Stacked area charts are available when a search generates multiple data series. Stacking is not available for line charts.
Use a stacked area chart to see more details about a series and how it relates to the entire data set. Review the comparison table here to select a stacking option.
Stack option | Column or bar appearance | Use case |
---|---|---|
Unstacked | Areas for different series share the same space on the chart. | An unstacked chart is useful for a lower number of series. As the number of series increases, the chart can become more difficult to understand. |
Stacked | Each series area is shown separately. | Use a stacked area chart to highlight the relative volume, frequency, or importance of a series. See the stacked chart example below. |
Stacked 100% | The chart shows distribution percentage for each series over the whole data set. | Use stacked 100% to focus on data distributions. |
Stacked area chart example
This search tracks throughput for different series over time.
index=_internal per_sourcetype_thruput | timechart sum(kb) by series useother=f
The search generates multiple series. Each series appears as a colored area of the stacked chart. The stacking lets you compare the sums for different series.
Pie chart
Use a pie chart to show how different field values combine over an entire data set. Each slice of a pie chart represents the relative importance or volume of a particular category.
Pie charts represent a single data series.
Pie chart example
This search portion aggregates events by Code field values.
... | chart count by Code
The search generates a single data series representing values in the Code field. Each Code value appears as a pie slice.
The chart is configured with a 5% minimum size. Field values that represent less than 5% of the total data set are combined into an other slice.
Pie chart format options
Use the Format menu to configure pie charts. Available configurations include the following options.
- Enable or disable drilldown.
- Set a minimum size to apply when there are more than 10 slices. Data values below the minimum are combined into an other slice.
Scatter chart
Use a scatter chart to show relationships between discrete data points.
Scatter charts work best with two data series. Columns in the Statistics table represent the following information.
Number of series | Statistics table column 0 | Statistics table column 1 | Statistics table column 2 |
---|---|---|---|
Two | marker names | x-axis values | y-axis values |
Scatter chart example
This scatter chart tracks recent earthquakes. The plotted markers show magnitude and depth frequencies over various earthquake events.
The search generates a two series data column.
source="earthquake.csv" | table place mag depth
In the scatter chart, markers represent place field values. Each marker shows the mag and depth field values for an earthquake at a particular location.
Scatter chart format options
Use the Format menu to configure a scatter chart. Formatting options include the following.
- Axis titles
- Legend placement and truncation
- Axis scale and interval values
- Axis minimum and maximum values
- Enable or disable drilldown
Bubble chart
Use a bubble chart to visualize multiple series data in three dimensions. Bubble position represents two dimensions of the data series. Bubble size represents the third dimension.
To create a bubble chart, start with a search that generates three data series. See the following example.
Bubble chart example
This search aggregates earthquake events by location. It generates three data series representing the magnitude, depth, and count for each earthquake location.
source="earthquake.csv" | stats count by place, mag, depth
The search generates a bubble chart where the x-axis and y-axis plot magnitude and depth. The bubble size indicates the relative count value for a particular location.
Bubble chart format options
Bubble chart configurations include the following options. Use the Format menu to adjust settings.
- Minimum and maximum bubble marker size
- Axis titles
- X-axis label rotation and truncation
- Axis scale, interval, minimum and maximum values
- Enable or disable drilldown
Single value visualization
Single value visualizations display results and context for searches returning a discrete number. This number can be a count or other aggregation of specific events. For instance, this visualization shows daily sales for a popular lemonade stand.
A caption, unit notation, and range colors add emphasis to a visualization. A trend indicator to the right of the value and a sparkline underneath show how data has changed over time
Search for a single value
Single value visualizations work best for queries that create a time series chart using the timechart
command or aggregate data using the stats
command.
Use timechart to generate a single value
This search and visualization use timechart
to track daily errors for a Splunk instance.
index=_internal source="*splunkd.log" log_level="error" | timechart count
To access sparklines and trend indicators, it is important that the search includes the timechart
command. Using timechart
means that time series data becomes available to sparkline and trend indicator processing.
- Note: If you pipe to
stats
as part of a fulltimechart
query, the visualization does not include a sparkline or trend indicator.
Use stats to generate a single value
If you use the stats
command to generate a single value, the visualization shows the aggregated value without a trend indicator or sparkline. As an example, this query and visualization use stats
to tally all errors in a given week.
index = _internal source = "*splunkd.log" log_level = "error" | stats count
Queries and time ranges for single values
It is important to set up the single value query that best drives the visualization that you expect.
- Search for a single value to avoid unexpected results in the visualization. In the Dashboard Editor, you can select single value visualizations even if a search returns multiple values. In this case, the single value visualization uses the value in the first cell of the results table.
- The time range picker and the query command work together to generate the results for a single value visualization. A query using
stats
results in a visualization showing the aggregated total of results in the time range. A query usingtimechart
generates a visualization showing the most recent result within that range.
For more information on the data structure requirements of single value visualizations, see Data Structure Requirements for Visualizations.
For details about the stats
command, see stats in the Search Reference.
For details about the timechart
command, see timechart in the Search Reference.
Sparklines and trend indicators
A sparkline appears below a single value generated with the timechart
command. It shows increases and decreases in a metric over the time range you specify in a search.
This visualization shows results for a search over the past week's data. Using the time range picker to select Week to date means that the sparkline reflects the data changes over the last seven days.
This visualization shows results for the same search over the past day's data. Using the time range picker to select Today means that the sparkline shows data changes over the past twenty-four hours.
A trend indicator appears to the right of a single value generated with the timechart
command. It shows recent data behavior over a customizable time range. The trend indicator is composed of a number and an arrow to represent what happened most recently in the data.
Depending on data behavior, the trend arrow can point up, down, or directly to the side to show no change. By default, the trend indicator value evaluates to the difference between the two most recent values in the results. You can change the trend time window in the Format menu's General settings panel or by adjusting the span
parameter for timechart
.
- Note: To include sparklines and trend indicators in a visualization, it is important that the search includes a
timechart
command.
Customize ranges and colors for single value visualizations
Colors can emphasize range values or trends in a single value visualization. In the Format menu, you can choose whether to use colors. If you opt to use colors, you can select whether to color by value or trend.
- Note: For queries using
stats
to aggregate results, only the color by value option is available.
You can also adjust the color mode to change whether colors appear in the foreground or background.
Depending on the color mode you choose, coloring a single value generated with timechart
by value means that the sparkline and trend indicator appear black (for foreground color) or white (for background color).
Color by value
Coloring by value is available for single value visualizations generated with either stats
or timechart
. Color by value means that the single numeric value in the visualization changes color based on the value the search generates and the range for that value. For example, if you map a value range from 30-50 to the color yellow, then a single value of 35 appears yellow.
You can adjust value ranges for the query to change how different results are visualized. By default, there are five ranges and colors for coloring by value. You can add or remove ranges, modify the values for each range, and change the colors associated with each range using the Format menu.
For example, this timechart
generated single value visualization shows color by value and has the background color mode selected.
Color by trend
Coloring by trend is available for single values generated with a query including the timechart
command. Coloring by trend means that the sparkline and trend indicator in this visualization change color to show changes in data. By default, positive changes make the sparkline and trend indicator appear green, while negative changes make them red. When results show no change, the trend color is black.
For example, this visualization shows color by trend and has the foreground color mode selected.
You can reverse the settings for trend colors in the Format menu. You can also specify a different trend time window for the visualization.
Migration for rangemap
settings in existing single value visualizations
Existing single value visualizations might use a query with the rangemap
command to configure ranges and colors.
By default, a single value visualization has this color mapping configuration for ranges.
low
: greenguarded
: blueelevated
: yellowhigh
: orangesevere
: red
Caution: As support for the rangemap
command is limited, it is not recommended for building new single value visualizations. Queries using rangemap
currently generate a single value, but UI configurations override the query-based settings.
For existing single value visualizations, it is recommended to migrate rangemap
command settings out of the query. Replace query-based settings with equivalent range and color settings in the Format menu Color panel.
Captions and units for single value visualizations
Use the Format menu's General options panel to add a caption for a single value visualization. You can specify a unit of measurement and its position in the Number Format panel. For instance, you can add $ before a value reflecting sales in the United States or MB after a value tracking data transfers.
- Note: If you are migrating from earlier versions of Splunk software and your visualization includes Before and After labels, the Format menu shows prompts to update label and unit text using the Unit and Caption fields.
Captions for single value visualizations
Captions add descriptive context to a single value visualization. To add a caption, select the Format menu General panel. Use the caption text field here to enter a description. Captions appear below the single value.
Units for single value visualizations
Units can indicate standard measurements for single values. To add a unit to the visualization, select the Format menu Number Format panel and edit the Unit field. You can choose whether a unit appears before or after the value. It is recommended to keep unit text to five characters or fewer. Use a caption for longer text.
Single value number formatting
If you are working with a large single value or one that requires precision, you can change the number formatting for the visualization. In the Format menu Number Format panel, you can choose thousand separators or different degrees of decimal precision.
Drilldown for single value visualizations
By default, drilldown is disabled for single value visualizations. You can enable drilldown functionality using Simple XML. For more information about drilldown, see Understand basic table and chart drilldown actions in this manual.
Gauge
Use a radial, filler, or marker gauge to map a value in relation to a range. A gauge visualization provides metric status and range information that you can interpret quickly. You can use a real-time search to generate a gauge tracking value fluctuations as they occur.
Radial gauge
A radial gauge includes a round value scale and a pointer to show the current value on the scale. The current value also appears at the bottom of the gauge. You can configure a radial gauge to use specific colors for each value range in the scale.
If the search generates a current value outside of the configured minimum or maximum range, the gauge pointer bounces at the lower or upper end of the value scale.
Example radial gauge
This search aggregates error log events.
index=_internal source="*splunkd.log" log_level="error" | stats count as errors
The search generates this radial gauge. The current error event count is 20.
Filler gauge
A filler gauge includes a value scale container that fills and empties as the current value changes. The fill level shows where the current value is on the value scale.
The current value also appears inside the filled portion of the gauge. The container appears empty for a value lower than the minimum and full for a value higher than the maximum.
Example filler gauge
This search aggregates error log events.
index=_internal source="*splunkd.log" log_level="error" | stats count as errors
The search generates this filler gauge. The current error log event count is 20.
Marker gauge
A marker gauge shows value ranges and colors with a marker that moves to indicate the current value.
If the search generates a current value outside of the configured minimum or maximum range, the marker bounces at the lower or upper end of the value scale.
Example marker gauge
This search aggregates error log events.
index=_internal source="*splunkd.log" log_level="error" | stats count as errors
The search generates this marker gauge. The current error log event count is 20.
Gauge configuration options
Use the Format menu Visualization Editor to configure gauge style and color ranges.
Gauge color range configuration
Use the Format>Color Ranges panel to select manual or automatic color range configuration. By default the first three ranges are green, yellow, and red.
Set the Color Ranges handling to Automatic if the query includes the gauge
command for range configuration query. If the query includes gauge
, any manual color range configuration from the Format menu overrides the original gauge
command settings.
Map
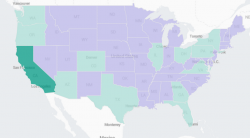
For information on Choropleth maps and other geospatial visualizations, see Mapping data.
PREVIOUS About this manual |
NEXT Data structure requirements for visualizations |
This documentation applies to the following versions of Splunk® Enterprise: 6.4.0, 6.4.1, 6.4.2, 6.4.3, 6.4.4, 6.4.5, 6.4.6, 6.4.7, 6.4.8, 6.4.9, 6.4.10, 6.4.11
Feedback submitted, thanks!