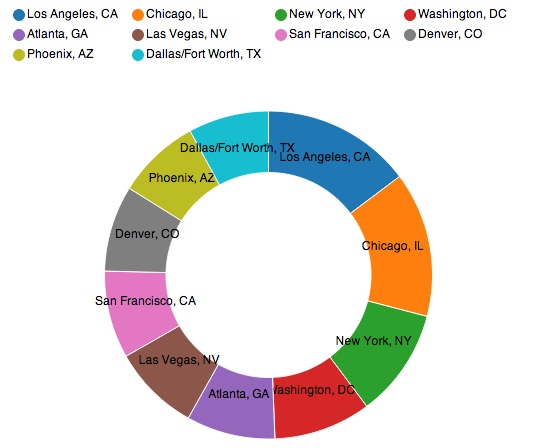

The D3Chart view displays data in a D3 chart. For examples of reusable D3 charts and components, see the NVD3 website.
Name | Default value | Description |
| id | Required. The unique ID for this control. | |
| type | "lineChart" | Required. The type of chart to display:
Cumulative Line: "cumulativeLineChart" Discrete Bar: "discreteBarChart" Horizontal Multi Bar: "multiBarHorizontalChart" Line Plus Bar: "linePlusBarChart" Line with View Finder: "lineWithFocusChart" Pie: "pieChart" Scatter/Bubble: "scatterChart" Simple Line: "lineChart" Stacked Area: "stackedAreaChart" Stacked/Grouped Multi-Bar: "multiBarChart" |
| data | "preview" | The type of data to retrieve from the search results ( results | preview | events | summary | timeline ). |
| managerid | null | The ID of the search manager to bind this view to. |
| settings | The properties of the view. See the methods below to get and set values. | |
| setup | null | Creates the chart by running a function that takes a single "chart" argument. Set any additional chart-specific properties within this function. For information about the properties that are required for a given chart type, refer to the NVD3 website. |
Name | Description |
| render | Draws the view to the screen. Called only when you create the view manually. |
| settings.get( property ) | Returns the value of property for the current component. |
| settings.set( property, value ) | Sets the value of property to the specified value for the current component. |
require([
    "splunkjs/mvc/d3chartview",
    "splunkjs/mvc/simplexml/ready!"
], function(D3ChartView) {

    // Instantiate components
    var donut_chart = new D3ChartView({
        id: "example-d3chart",
        managerid: "example-search",
        type: "pieChart",
        setup: function(chart){
            chart.color(d3.scale.category10().range());
            chart.donut(true);
        },
        el: $("#myd3chart")
    }).render();
});