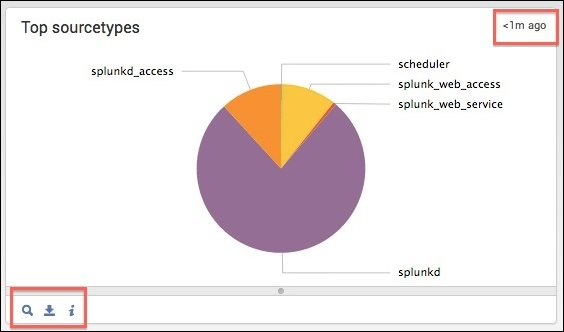
When a Simple XML dashboard is converted to HTML, each visualization is converted into a SplunkJS Stack view with a wrapper. For example, the dashboard chart visualization is converted into a SplunkJS Stack ChartView with a ChartElement wrapper. This wrapper includes a panel that provides additional features such as a timestamp, and buttons to open the search, export results, and open the search job inspector:
When you are working with wrappers in converted HTML dashboards, in addition to the SplunkJS Stack view properties, you can also set properties to customize the panel implementation.
Name | Default value | Description |
| link.exportResults.visible | Indicates whether to show the Export button at the bottom of the panel. | |
| link.inspectSearch.visible | Indicates whether to show the Inspect button at the bottom of the panel. | |
| link.openSearch.search | The alternative search query to use for the Open in Search button. | |
| link.openSearch.searchEarliestTime | The earliest time to use for the alternative search specified by link.openSearch.search. | |
| link.openSearch.searchLatestTime | The latest time to use for the alternative search specified by link.openSearch.search. | |
| link.openSearch.text | "Open in Search" | The label to use for the Open in Search button. |
| link.openSearch.ViewTarget | "Search" | The name of the target view for the Open in Search button. |
| link.openSearch.visible | Indicates whether to show the Open in Search button at the bottom of the panel. | |
| link.visible | true | Indicates whether to show link buttons at the bottom of the panel. |
Name | Description |
| getVisualization | Retrieves the Simple XML visualization in an extension. |
This example shows how to instantiate a Chart element wrapper in an HTML dashboard:
    var element1 = new ChartElement({
        // Set chart view properties
        "id": "element1",
        "charting.chart": "pie",
        "managerid": "search1",
        "el": $('#element1'),
        // Set wrapper panel properties
        "link.openSearch.text": "Go to the Search app",
        "link.exportResults.visible": false
    }, {tokens: true}).render();
This example shows how to access a Chart visualization that was instantianted in a dashboard using a Simple XML extension:
require([
    "splunkjs/mvc",
    "splunkjs/mvc/simplexml/ready!"
], function(mvc) {

    // Get the chart
    var myChart = mvc.Components.get('chart1');

    // Programmatically change a property in the Events table
    myChart.getVisualization(function(chartView) {
        chartView.settings.set({
            "charting.axisTitleX.text": "My x-axis ",
            "charting.axisTitleY.text": "My y-axis ",
            "charting.legend.placement": "top",
        });
    });

});