View alerts in Splunk Observability Cloud 🔗
Alerts are highly relevant to the health of your services and applications. Observability Cloud shows alerts in all places where they matter, so that you don’t miss on important information.
You can view active alerts on the Alerts page, from charts and detectors, or access them from APM.
Review all active alerts in your organization 🔗
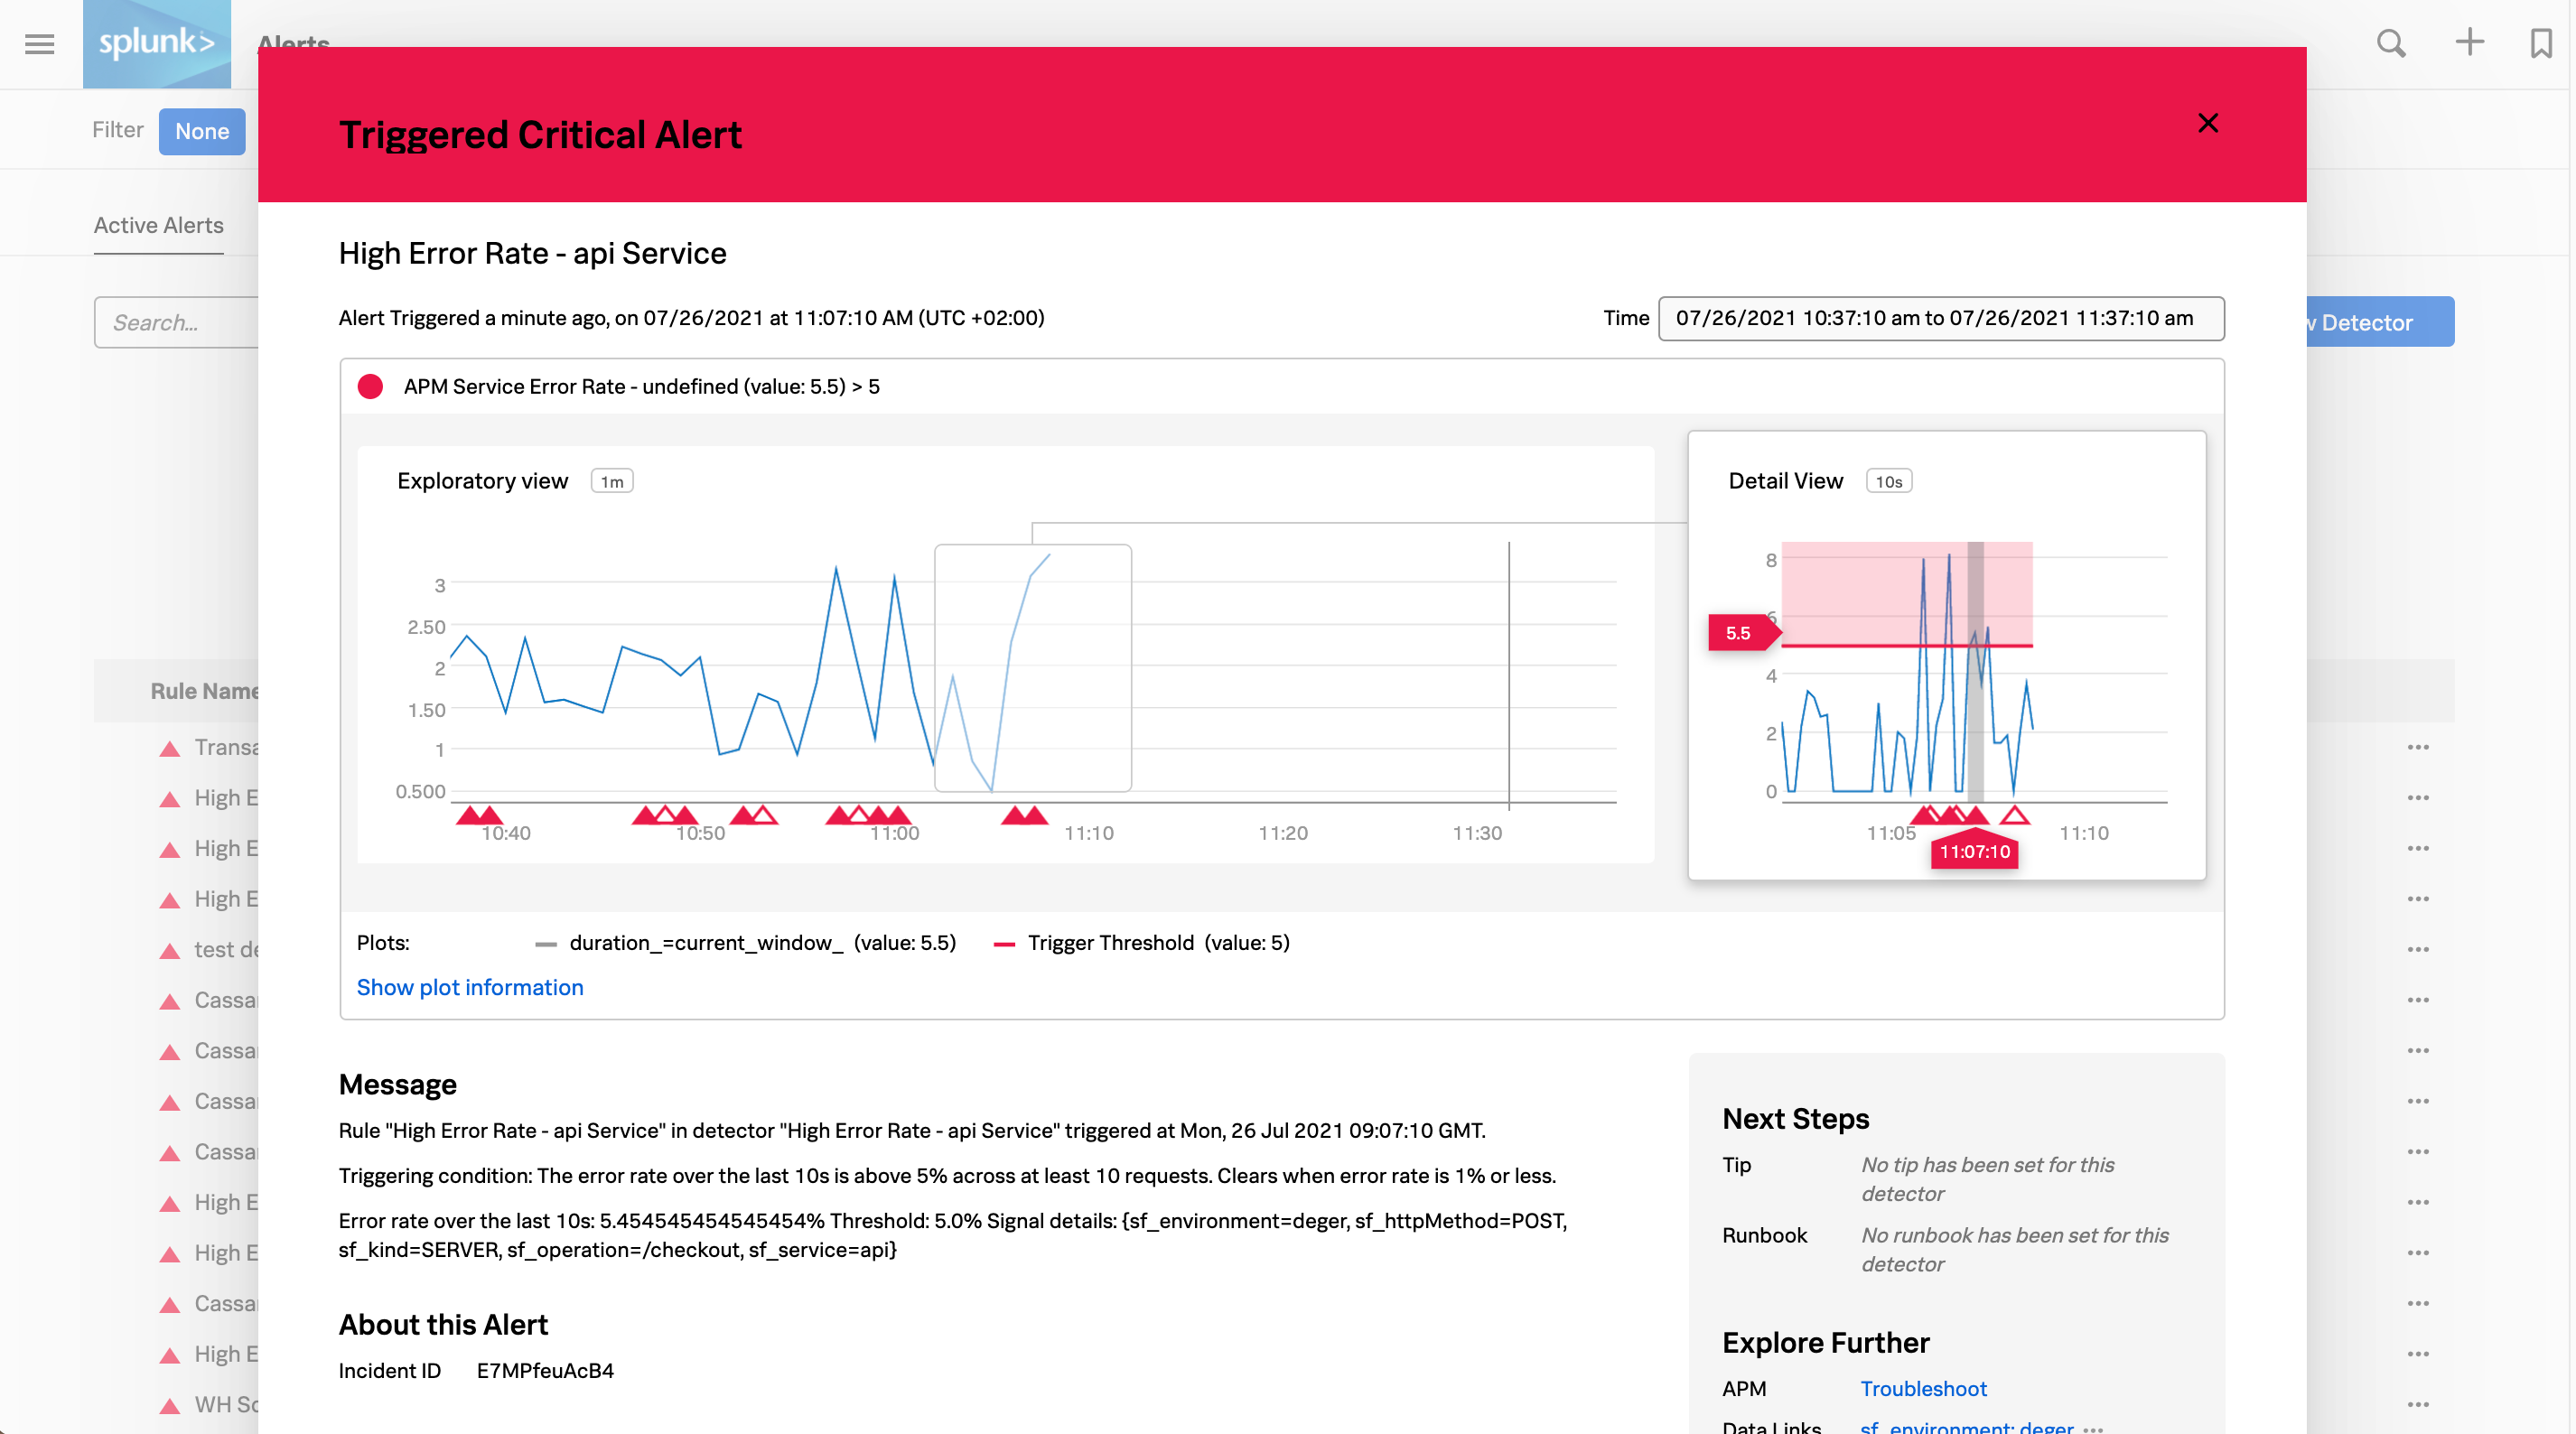
To review all the active alerts in your organization, go to Alerts. The Active Alerts tab shows the number of active alerts at each severity level, from critical to informative.

The table lists all active alerts matching the conditions you’ve entered. If a notification for an alert is muted, a notifications muted label is shown next to the alert.
To see more details about the alert, select its rule name and source in the table. In the details dialog box, you can select Resolve the alert, open the detector that triggered the alert, and explore related items.
Note
If you can’t find an alert, apply a filter to reduce the number of matching alerts.
Filter alerts to reduce noise 🔗
You can select any of the alert counters to filter alerts by the corresponding severity level. You can also use Filter to show only alerts that are relevant to specific tags or dimensions.
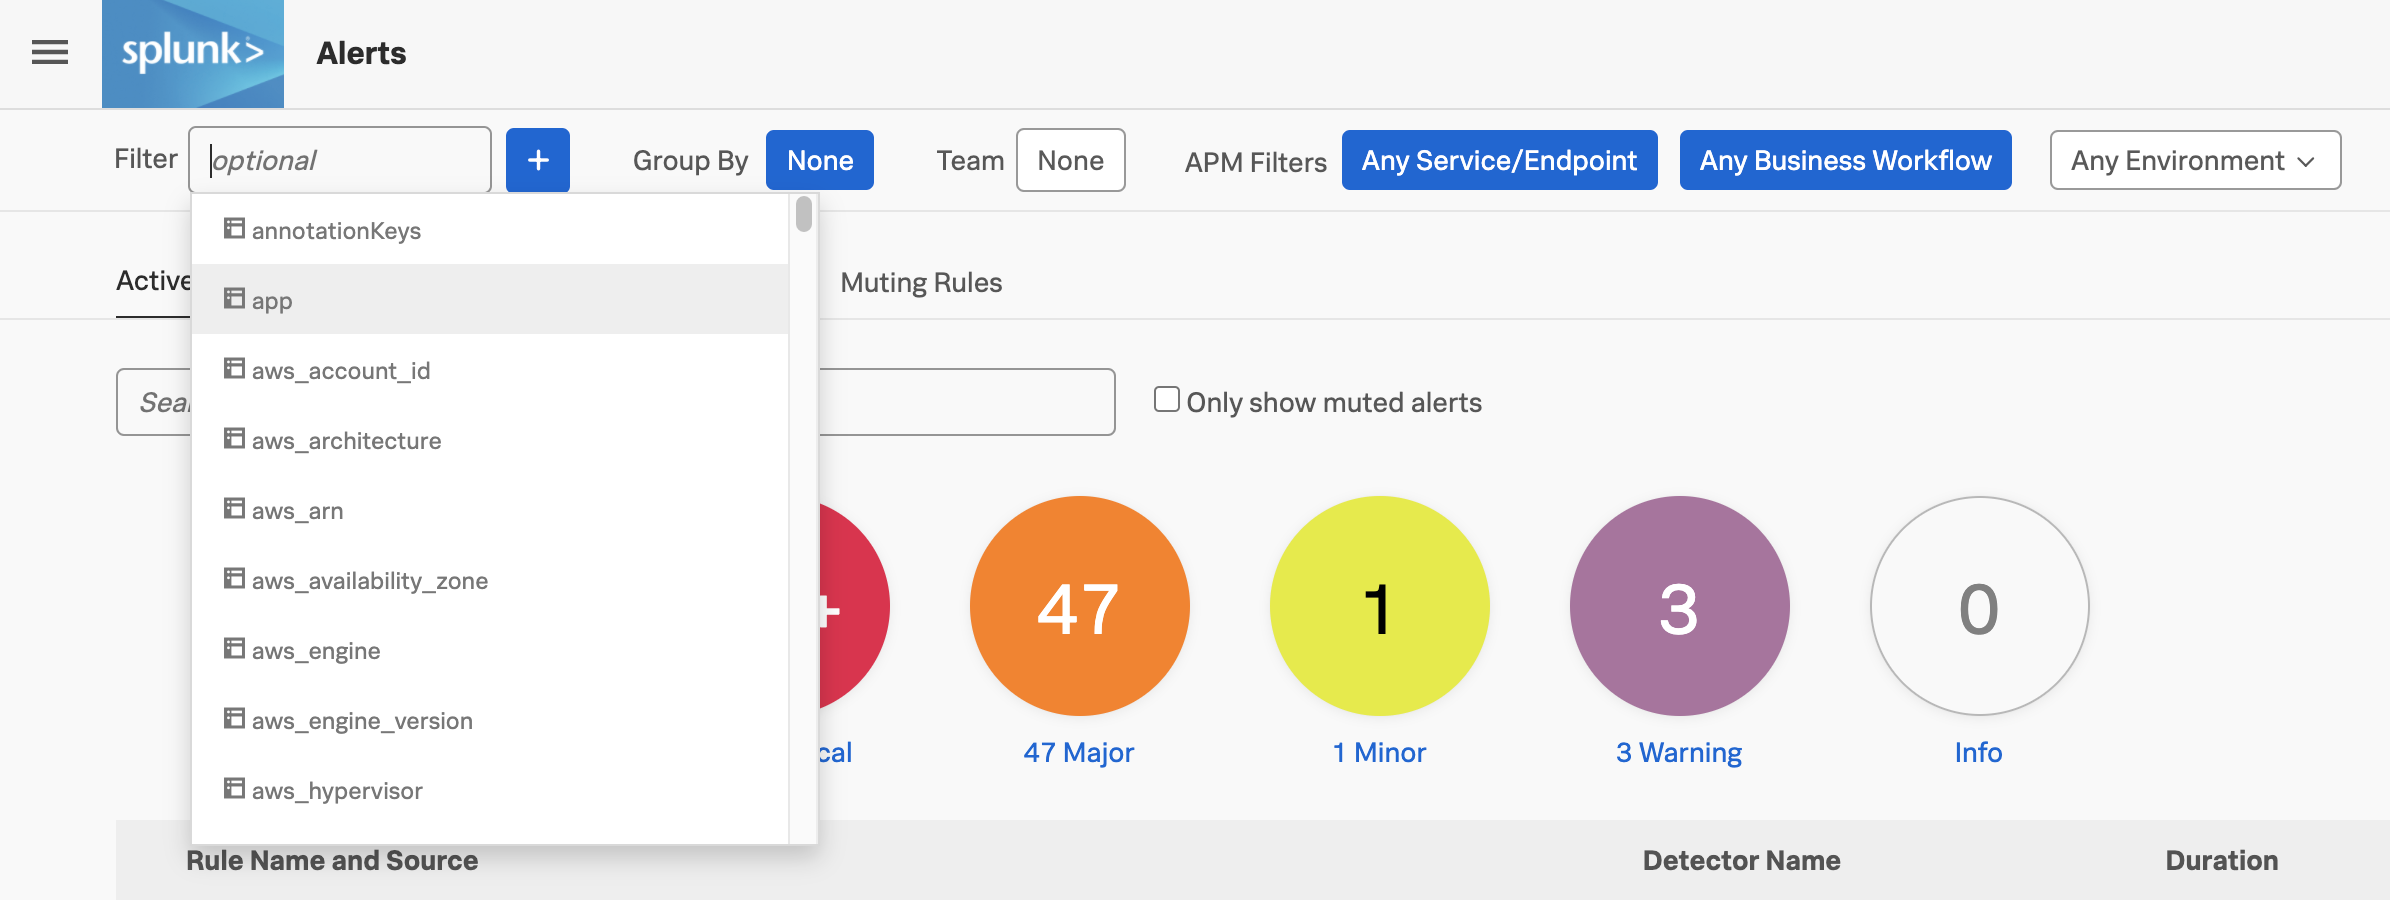
To filter by service, endpoint, environment, or business workflow, set the APM Filters.
Group alerts by properties or dimensions 🔗
Use Group by to group active alerts by one or more properties. For example, you can group alerts by host first, followed by the AWS region. When you select two levels, hierarchical grouping is also applied to the list.

See which alerts are active for a detector 🔗
To view active alerts for a detector, go to the Detectors tab in Alerts and select a detector.
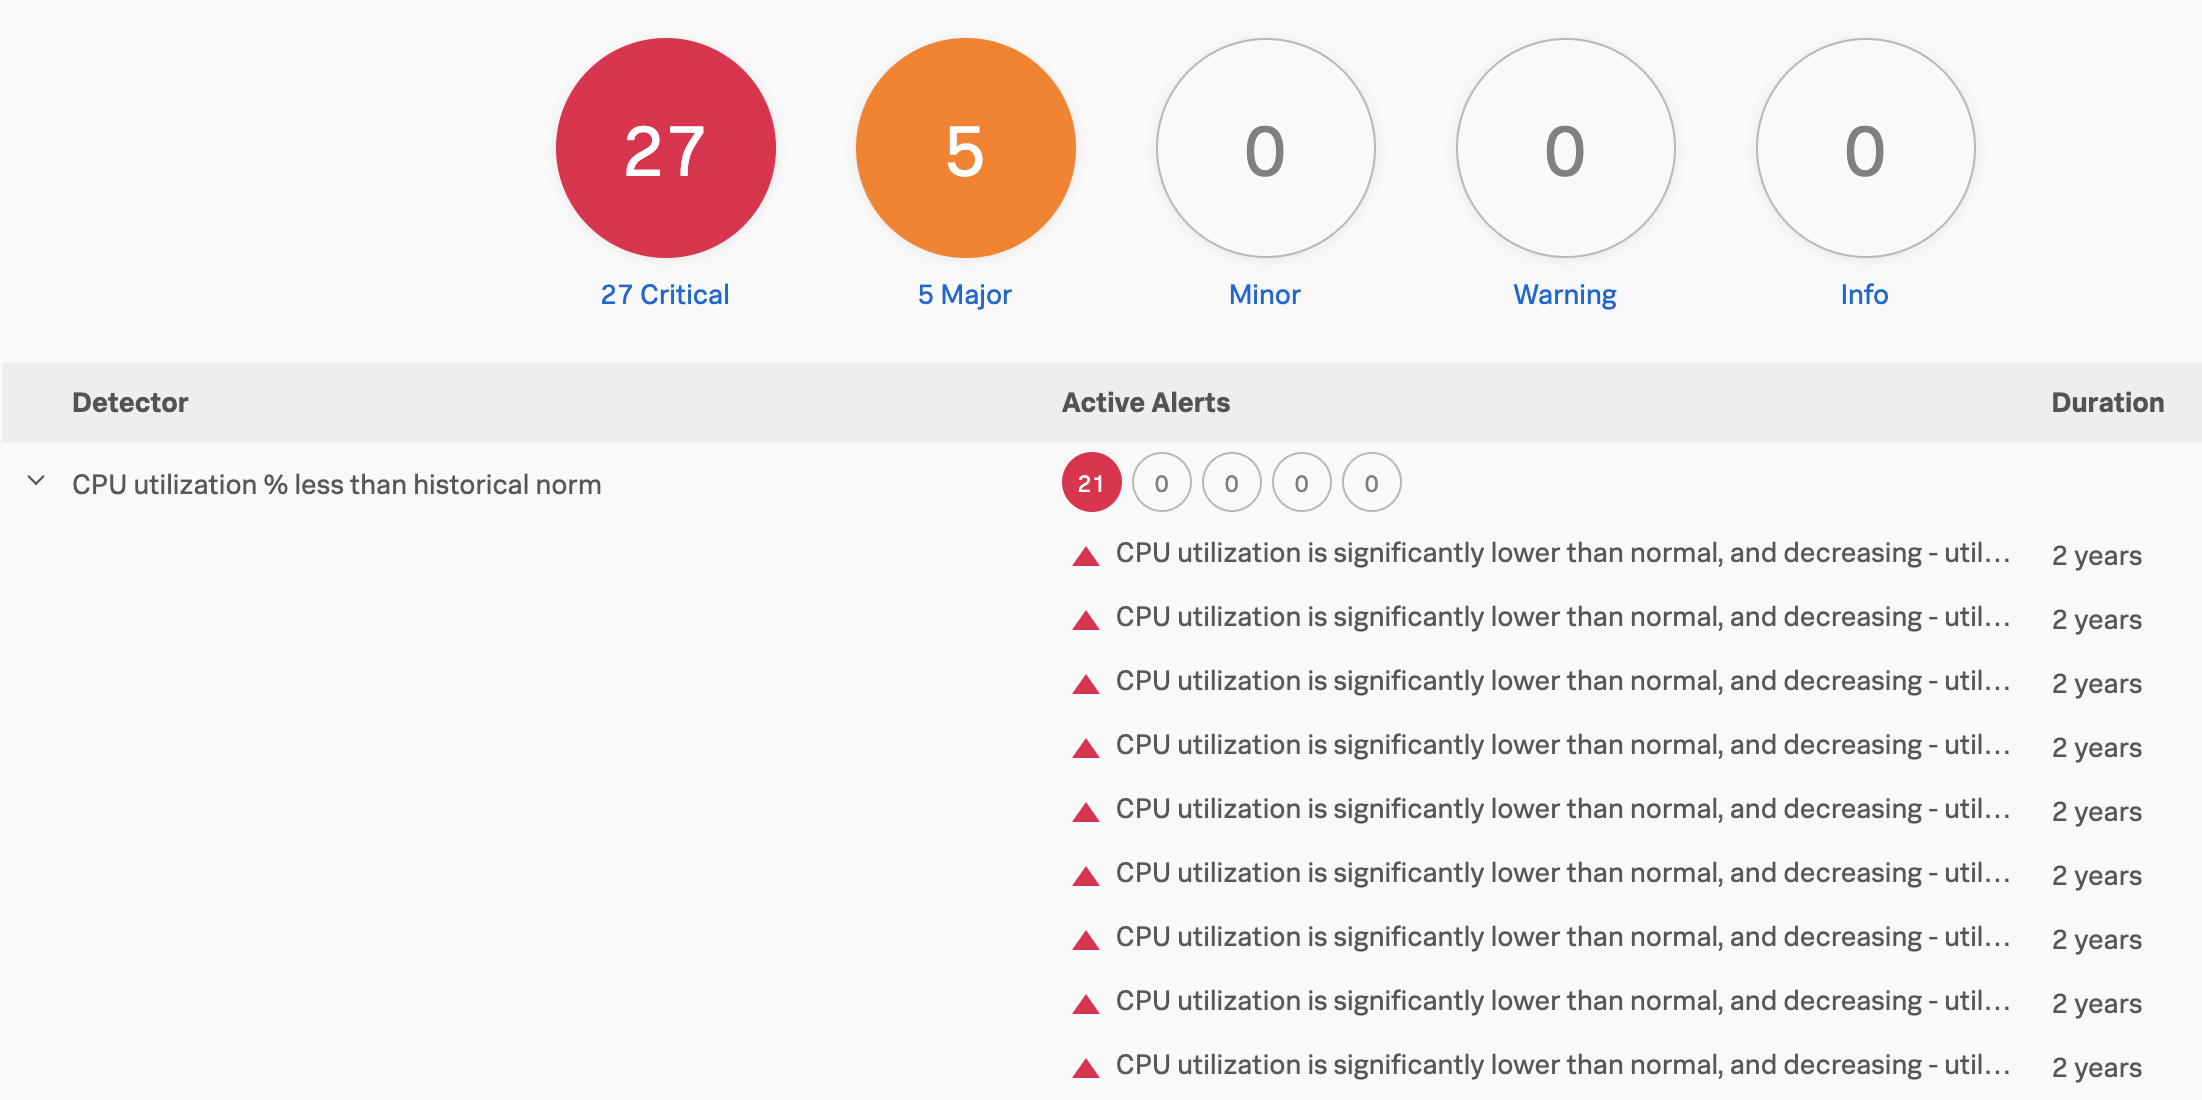
To open a detector, select its name. When you open a detector, a counter for each alert rule shows the number of active alerts that apply to the detector.
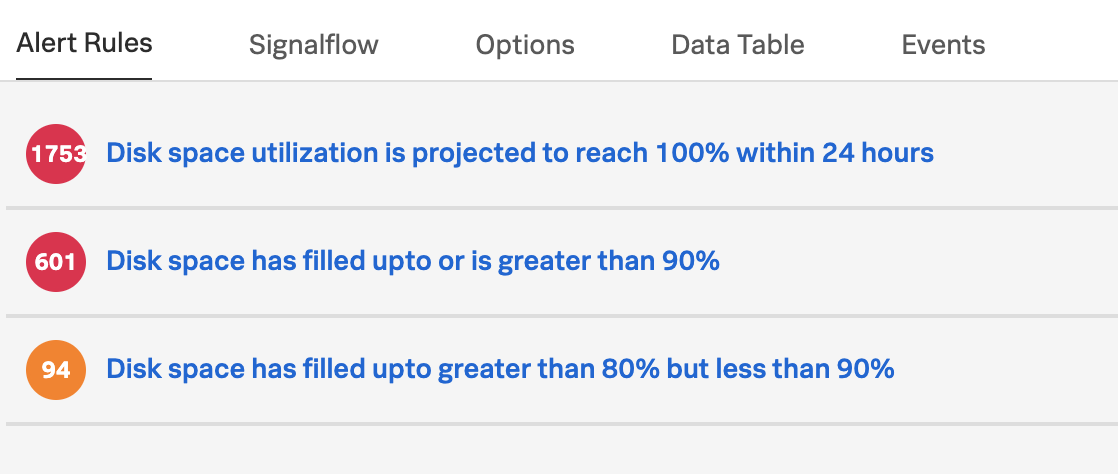
Select any of the counters to view a list of active alerts for that rule. If there are multiple filters in the view, you can remove any of them to see a wider range of alerts for that detector.
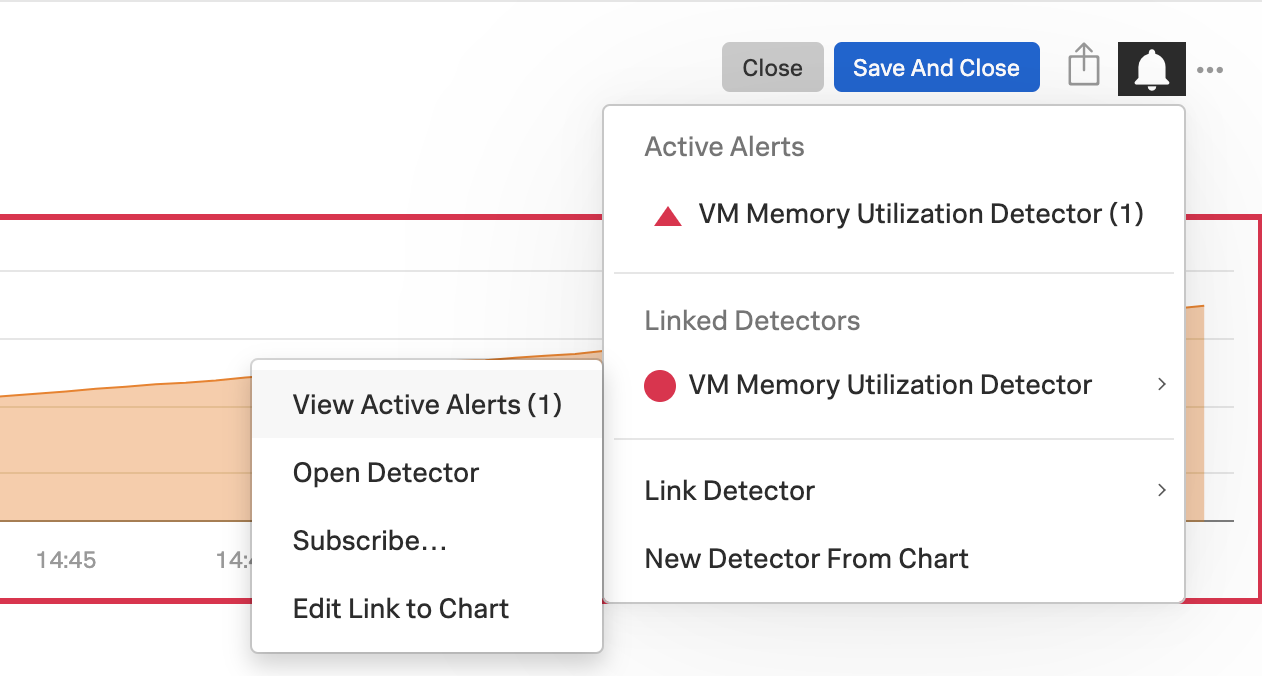
Identify alerts from your charts 🔗
You can view alerts from charts or in the Infrastructure Navigator by browsing related detectors.
Open the Detector menu by clicking the bell icon at the top right corner of a chart.
Select an active alert or hover over a detector and select to see all active alerts for that detector.
Find which service has active alerts in APM 🔗
To view active alerts for the services you’re monitoring in APM, go to APM. Active alerts appear in the Services and the Business Workflows tabs under each service name.
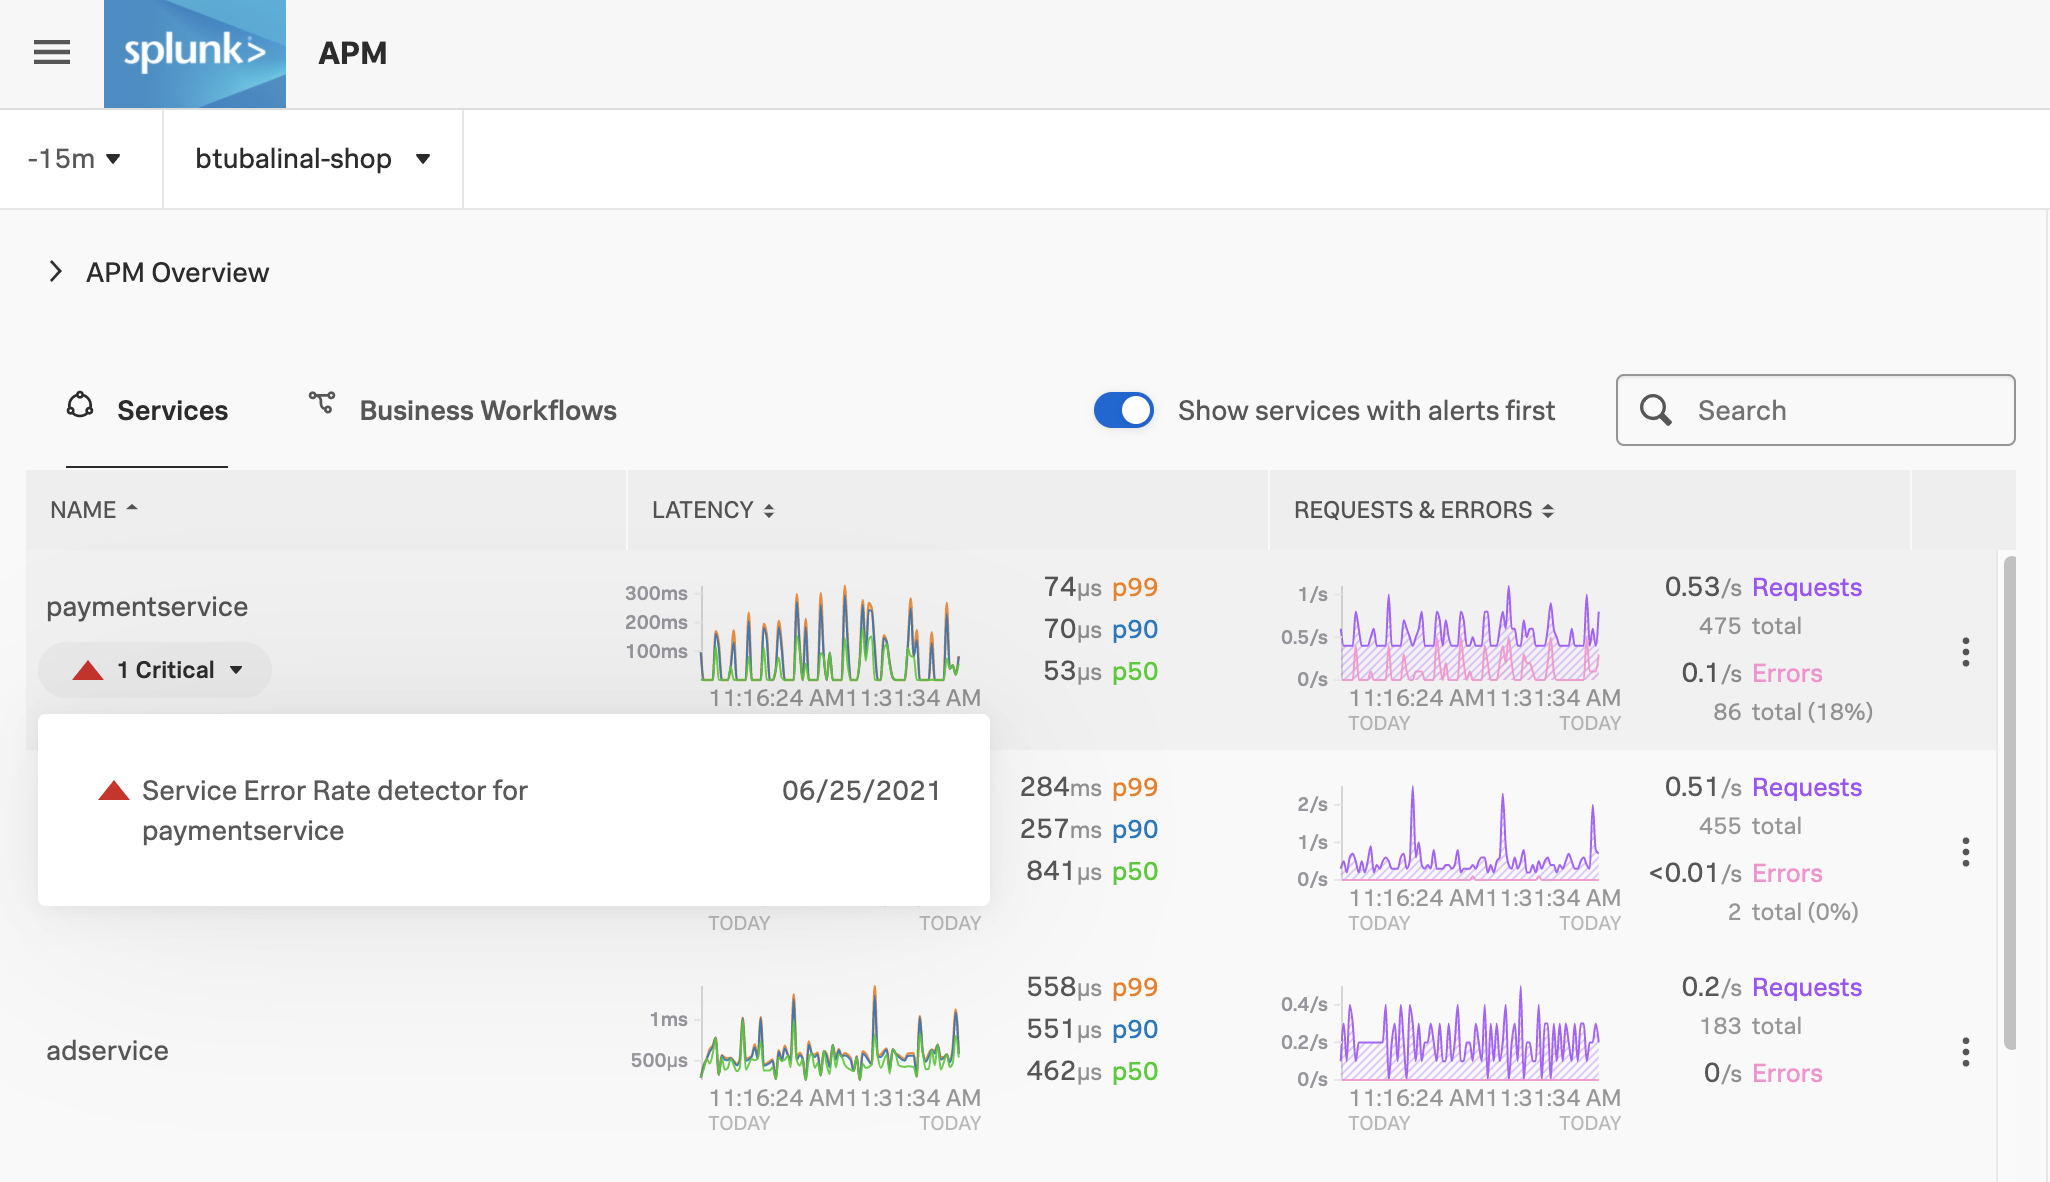
Select a service with an active alert to check how the service is affected.