Infrastructure Monitoring subscription usage (DPM plans) 🔗
Note
Read this document if your organization’s subscription plan is based on the rate at which you are sending data points to Splunk Infrastructure Monitoring (DPM). If your usage plan is based on the number of hosts or metrics that you’re monitoring with Infrastructure Monitoring, see Infrastructure Monitoring subscription usage (Host and metric plans).
This topic describes general aspects of your usage and consumption. For more detailed billing-related queries, contact your Splunk Account Team.
Observability Cloud provides a summary and detailed subscription usage reports to help you understand and manage the data you monitor with Infrastructure Monitoring. This information is available to Admin users only.
Access the Subscription Usage page 🔗
In DPM subscription plans all metrics are categorized as custom, regardless of their origin.
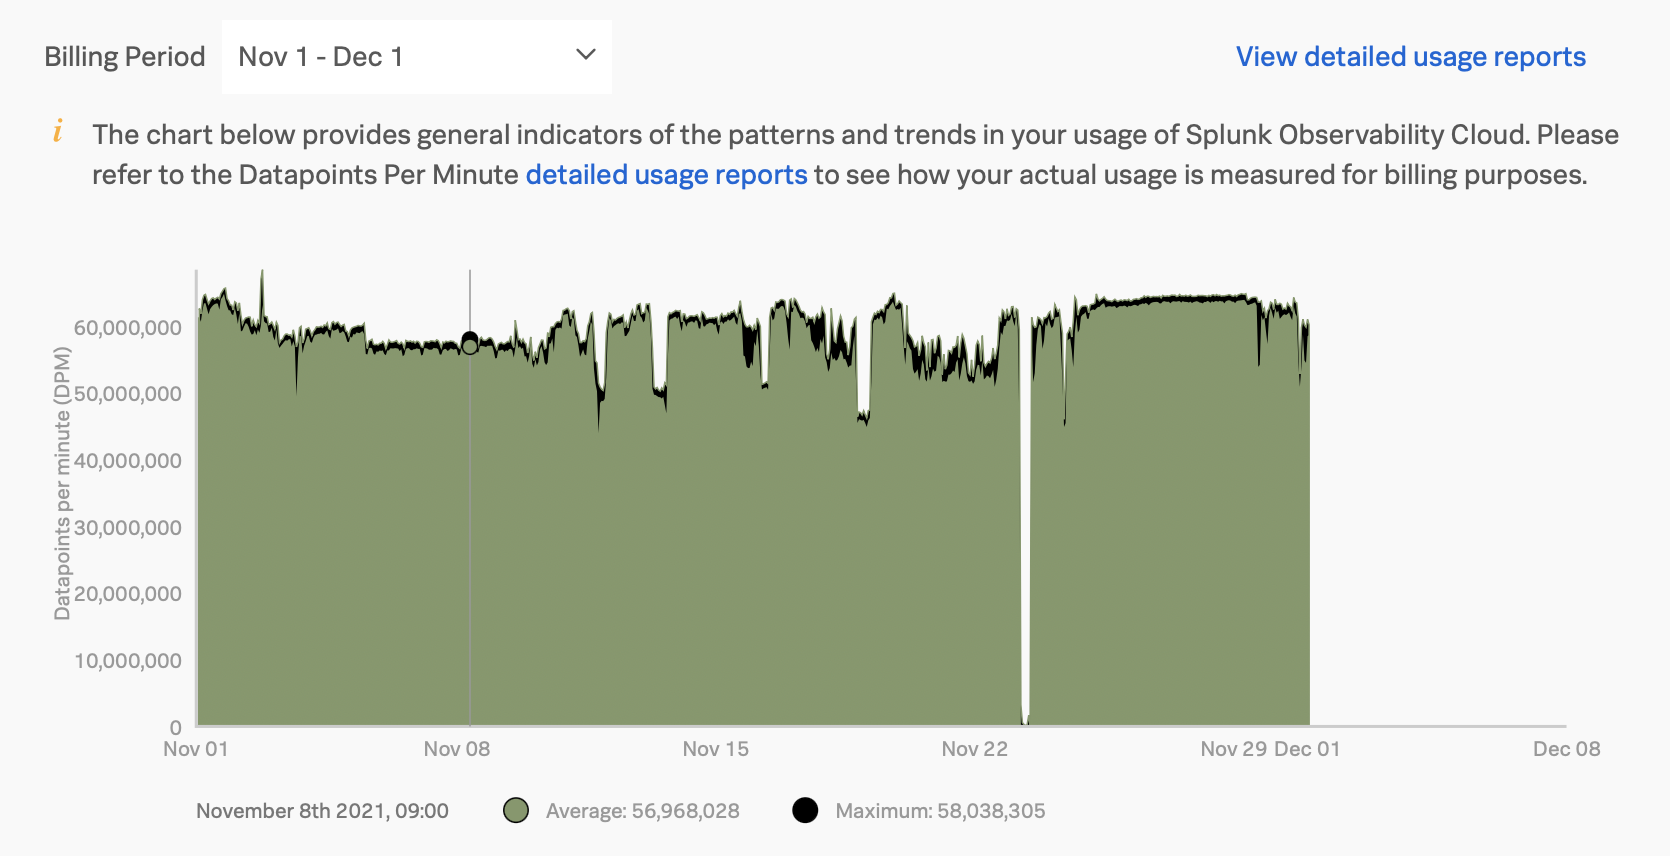
Go to to see a usage chart that shows average and maximum DPM for the current usage period. Hovering over different points in the chart shows actual values below the chart. To see average and maximum usage for a previous period, select the desired period from the dropdown menu.
View and download usage reports 🔗
To view usage reports available for download, go to View detailed usage reports and select the Usage and Usage Breakdown tabs.
Observability Cloud provides you with the following summary reports to help you understand and manage your metrics submission:
Data points per minute detail report. Shows the total number of data points sent for each minute of a month (or month to date, for the current month). This information is helpful for understanding whether your rate of data submission has stayed within the limits of your Splunk Infrastructure Monitoring subscription.
Aggregate data points per minute detail report. Similar to the first report, it includes information on child organizations.
Data points per dimension report. Shows on a daily basis the number of data points and time series for a given dimension value, as well as its average reporting frequency (resolution). It is useful for understanding the nature of the data your organization is sending so you can tune it accordingly. For example, you might notice that there are some metrics which you do not want to send at all, and conversely, you might see that there are some metrics that you want to send at a higher resolution.
All reports are tab-separated text files that you can import into a spreadsheet application, such as Microsoft Excel, Google Sheets, and Apple Numbers.
You can also request on demand reports with detailed information about metric time series (MTS). See On demand reports for more information.
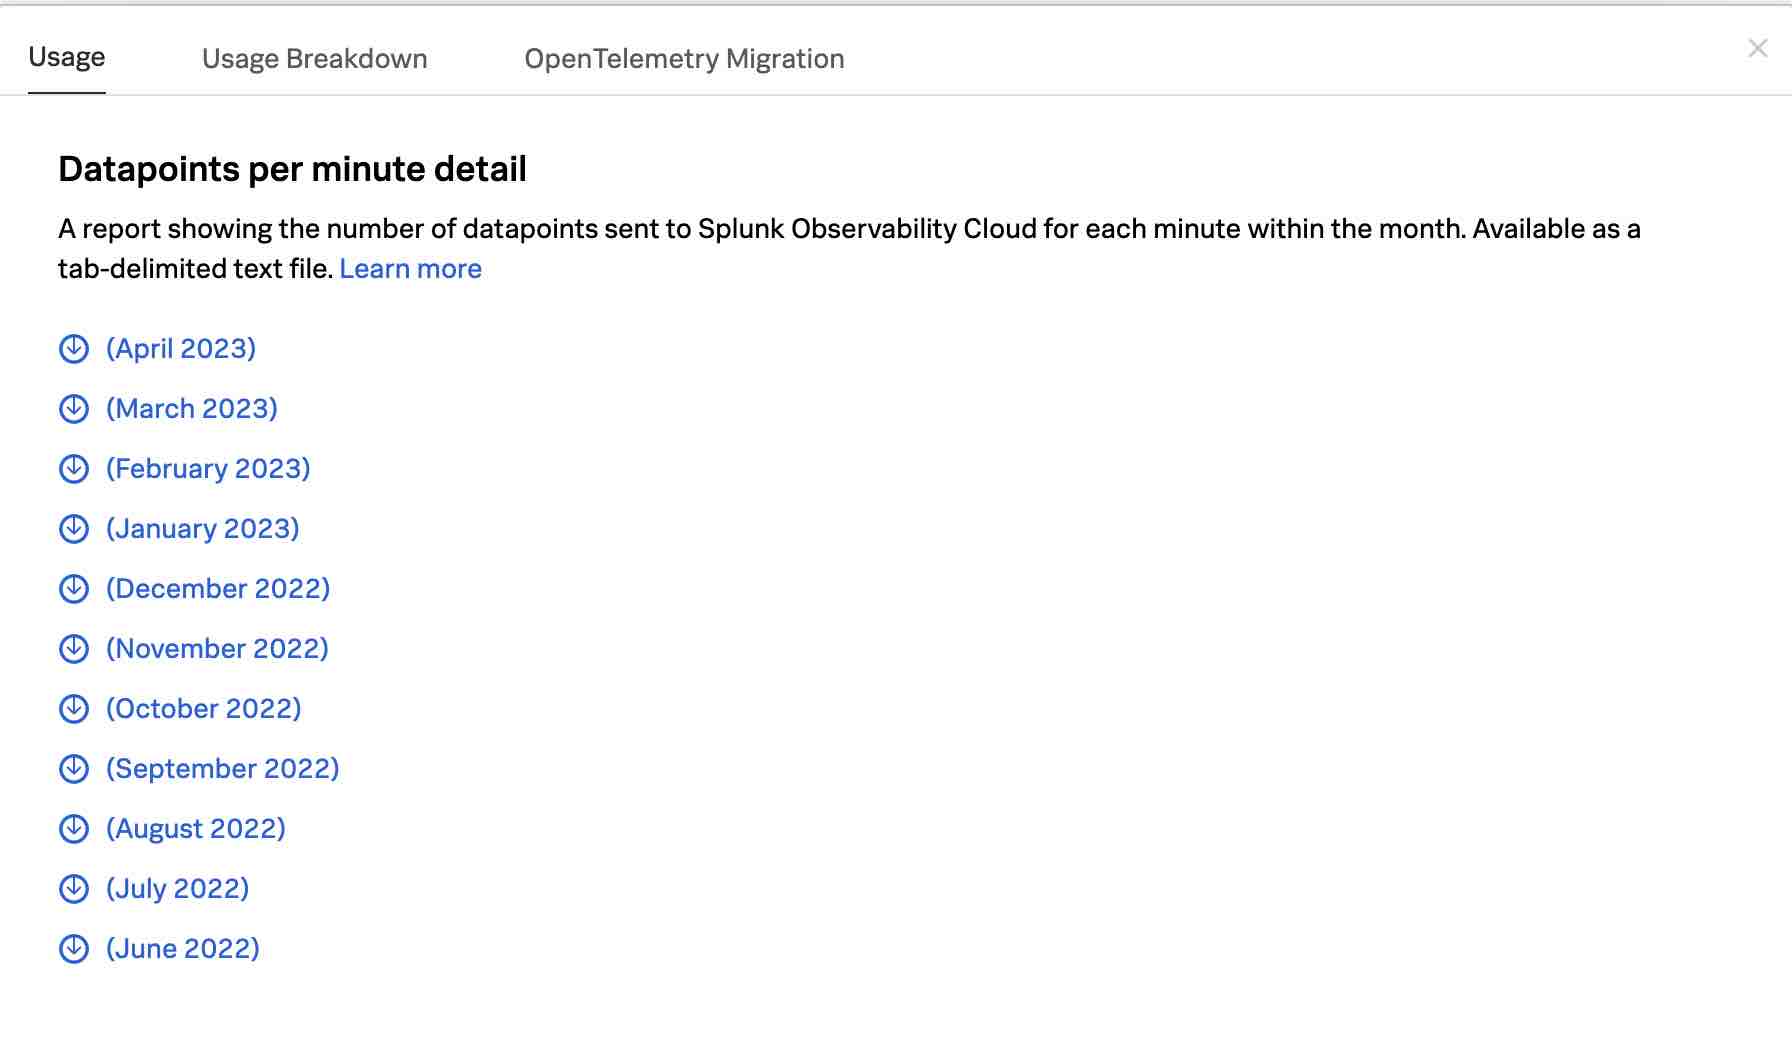
Data points per minute detail report 🔗
This report, available on the Usage tab, shows the total number of data points sent for each minute of a month (or month to date, for the current month). It follows your usage period, and uses the month in which a usage period starts as the label in the report link. For example, if your usage period starts on the 10th of the month, then a link for ‘March 2023’ will cover the period of March 10 through April 9, 2023.
Report contents 🔗
The report has five columns:
Date: Follows the mm/dd/yy format
Time: 24 hour hh:mm UTC
Streaming Datapoints: The number of data points received by Splunk Infrastructure Monitoring through our ingest APIs for the specified date and time.
Backfill Datapoints: The number of data points received by Splunk Infrastructure Monitoring through the backfill API for the specified date and time.
Throttled Datapoints: The number of data points actively dropped by Splunk Infrastructure Monitoring for the specified date and time.
For past months, the report includes streaming, backfill and throttled data points for all of the minutes in that month. For the current month, the report includes the data points for the month-to-date, and updates once per day.
Use the report 🔗
The report shows you the detail of how many data points Splunk Infrastructure Monitoring is receiving from your organization on a per-minute basis. In general, this is useful if you want to determine whether your usage is in line with your subscription plan. Using the data, it is easy for you to calculate your average usage, how many minutes in the month you are over or under your plan, and by how much.
Aggregate data points per minute detail report 🔗
If you are working in an Splunk Observability Cloud organization that has a parent-child relationship with other organizations, you see an option for the Datapoints per minute report that includes information on child organizations.
Like the Data points per minute detail report, this report shows the number of data points sent to Splunk Infrastructure Monitoring for each minute within the month; including data from all child organizations.
Data points per dimension report 🔗
This report, available on the Usage Breakdown tab, shows on a daily basis the number of data points and time series for a given dimension value, as well as its average reporting frequency. Reports are for the 24-hour period (in UTC) represented by that date.
You can select or type in a date for this report. Data is retained for a limited amount of time.
Report contents 🔗
The report has seven columns:
Dimension Name
Dimension Value: Dimension Name and Dimension Value are the key/value pairs of the dimensions sent in with your metrics. Unique combinations of dimensions and metrics are represented as time series in Splunk Infrastructure Monitoring.
Number of Contributing Metric Time Series: The number of metric time series associated with the dimension name and value.
Total Datapoints Received per Day: The total number of data points received by Splunk Infrastructure Monitoring during the 24 hour period represented by the date of the report, again as associated with the dimension name and value.
Note that if you sum up the Total Datapoints Received per Day column, it is possible that your total is larger than what is reported in the Datapoints per Minute detailed usage report. This scenario occurs if any of your metrics report more than one dimension, in which case that data point is counted multiple times in this report (once for each dimension).
Average DPM: The data points per minute, averaged across the number of time series associated with the dimension name and value, and over the course of the 24 hour period represented by the date of the report.
Average Reporting Frequency for the Day: The time (in seconds) between successive data points, averaged across the number of time series associated with the dimension name and value, and over the course of the 24 hour period represented by the date of the report. For example: - a value of 10 means the data is sent every 10 seconds. It has a 10s frequency; - a value of 60 means that the data is sent every minute. It has a 1m frequency; - a value of 300 means that the data is sent every 5 minutes. It has a 5m frequency, as is the case with standard AWS CloudWatch metrics.
Frequency is calculated as an average across all of the time series associated with the relevant dimension value, rather than measured for each individual time series. As a result, it might contain outliers (for example, a time series that is reporting more slowly or with greater jitter or lag) that skew the average. For example, for data sent every 5 minutes (300 seconds), you might see a value of 280, or a value of 315. Treat frequency as an approximate value that guides what you do with your metrics, rather than a way of auditing the precise timing of them.
Number of Contributing Metric Time Series Which Were Created Today: The number of metric time series associated with the dimension name and value that are created over the course of the 24 hour period represented by the date of the report.
Using the report 🔗
Metric names: A good starting point for using the report is the
sf_metricdimension. The dimension values are the names of the metrics being sent in, and you can see how much data is sent in for each metric and at what resolution. Armed with this information, you can decide whether you want to send in that metric to Splunk Infrastructure Monitoring, and if so, how often.Amazon Web Services: If you are using the Amazon Web Services integration, you should also look at the namespace dimension. The AWS integration lets you select the services for which you want data, such as AWS Cloudwatch, and the namespace values tell you how much data is sent in for each AWS service that is on.
Hosts and instances: Finally, many people find the host, instanceId or similar dimensions worthwhile, as hosts or instances are often associated with different stages or environments. For example, you might decide that you want to have fewer metrics coming in from your test environment, and more from production. Knowing which hosts map to which stage or environment gives you insight into this question, and lets you manage your data submission accordingly.
On demand reports 🔗
To get a detailed breakdown of the MTS you’ve created and use, you can request a usage report for a specific time interval by contacting your tech support member or your account team. Learn more at Understand your metrics usage with metrics usage report.
Exceeding your system limits 🔗
When your DPM rate exceeds your subscription for a sustained period of time, Observability Cloud automatically restricts the data to process and store into the datapoints associated with existing MTS.
How do I exceed my subscription limits? 🔗
This pricing model is based on the rate at which you send datapoints to Splunk Observability Cloud, measured in datapoints per minute (DPM). For example, if you are measuring CPU utilization for a host once every 10 seconds, then that one host/metric combination will account for a rate of 6 DPM.
If your environment grows significantly after your initial sizing, then your DPM rate will grow as well. For example, if your subscription is sized for a 1,000 host environment but grows to 1,300 hosts, then your DPM rate will grow in proportion (all things being equal). Alternatively, if you send more metrics from the same set of sources, or if you send metric values more frequently, then DPM can also grow.
What is the user-visible impact when an account is limited? 🔗
Splunk Observability Cloud organizes the received datapoints into metric time series (MTS). An individual MTS is defined by the unique combination of a metric name and a set of dimensions, and is created and tracked in the Observability Cloud system as part of a datapoint.
If your account is being limited, datapoints (metric values) for an existing MTS will continue to be processed and stored, and can be used in charts and detectors. However, datapoints for new MTS will not be processed and stored, and charts and detectors that would be expected to include those datapoints will not do so.
I exceeded my system limits. What can I do? 🔗
If you exceed your system limits, you have two options:
Reduce your DPM.
Change to a pricing plan that is based on the number of hosts or metrics to monitor (Recommended). See more in Infrastructure Monitoring subscription usage (Host and metric plans).