Create and track investigations in
Track your investigations into security incidents on an investigation timeline. This tool lets you visualize and document the progression of an incident and the steps you take during your investigation. Add notable events, other events, and information from your action history.
Start an investigation
You can start an investigation in several ways in .
- Start an investigation from Incident Review while triaging notable events. See Add a notable event to an investigation.
- Start an investigation with an event workflow action. See Add a Splunk event to an investigation.
- Start an investigation from the Investigations dashboard.
- Start an investigation when viewing a dashboard using the investigation bar.
By default, users with the ess_admin and ess_analyst roles can start an investigation. See Access to investigations.
Start an investigation
Start an investigation from the Investigations dashboard.
- Click Create New Investigation.
- Type a title.
- (Optional) Type a description.
- Click Save.
Start an investigation from the investigation bar
When viewing dashboards in , you can see an investigation bar at the bottom of the page. You can use the investigation bar to track your investigation progress from any page in .
- Click the
 icon to create an investigation.
 - Type a title.
- (Optional) Type a description.
- Click Save.
The investigation is loaded in the investigation bar.
Track an investigation
Track the progress of your investigation into a potential security incident, or plot the timeline of an attack, exfiltration, or other time-based security incident. While you conduct your investigation using , you can add notable events or Splunk events that add insight to the investigation. Add searches, suppression filters, and dashboard views to the investigation from your action history. See Your action history.
Record important investigation steps that you take, such as phone, email, or chat conversations as notes on the timeline. You can use notes to add relevant information like links to online press coverage, tweets, or upload screenshots and files.
You can track an investigation using the investigation bar, maintaining context for your investigation as you move across different dashboards in Enterprise Security.
![]()
- Load an existing investigation timeline into the bar by clicking the
 icon and selecting an investigation. You can only add investigations to the investigation bar if you are a collaborator with write permissions on the investigation.
 - Click the
 icon to view a timeline view of your investigation and review the progression of events in the investigation.
Add a notable event to an investigation
You can add a notable event to an investigation from the Incident Review dashboard. See Add a notable event to an investigation.
Add a Splunk event to an investigation
- Expand the event details to see the Event Actions menu and other information.
- Click Event Actions and select Add to Investigation.
- A tab opens. Select from existing investigations, or create one.
- Click Save.
Add an entry from your action history to an investigation
The action history stores a history of the actions that you have performed in , such as searches that you have run, dashboards you have viewed, and per-panel filtering actions that you have performed.
Add an entry from your action history to an investigation from a dashboard with the investigation bar. You can filter action history items by type or time to find the action history items.
- From the investigation bar, click the
 icon.
icon. - Find the actions that you want to add to the investigation.
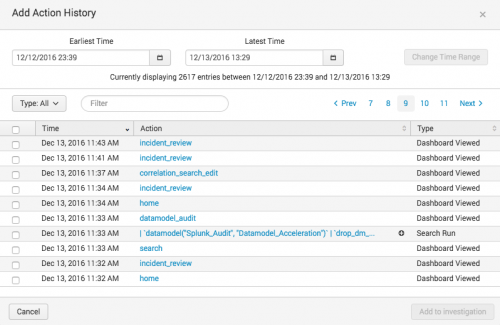
- The most recent actions that you've taken display in the action history dialog box. You can only add actions from your own action history.
- Search, sort by time, or filter by action type (search run, dashboard viewed, panel filtered, notable status change, or notable events suppressed) to locate the action you want to add.
- For searches, click the plus sign to view the full search string and verify that you are adding the correct search.
- Select the check box next to the action or actions that you want to add to the investigation timeline.
- Click Add to Investigation.
The actions are added to the investigation that you are viewing or that is selected in the investigation bar.

See Your action history.
Add a note
Add a note to an investigation to record investigation details or add attachments. You can add a note from dashboards in .
- From the investigation bar, click the
 icon.
icon. - Type a title.
For example, "Phone conversation with police." - (Optional) Select a time. The default is the current date and time.
For example, select the time of the phone call. - (Optional) Type a description.
For example, a note to record a phone conversation might include the description: Called the police. Spoke with Detective Reggie Martin. Discussed an employee stealing identities from other employees.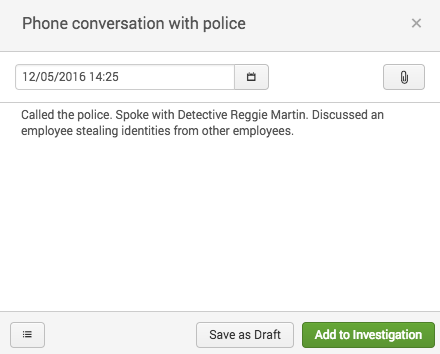
- (Optional): Attach a file to the note.
- From the note, click the
 icon or drag the file onto the note.
 - Select a file to add from your computer.
The maximum file size is 4 MB. You can add multiple files to a note. The first file you add to the note previews on the investigation timeline.
- From the note, click the
- Click Add to Investigation to add the note to the open investigation or click Save as Draft.

Note: When you save a note as a draft, it stays associated with the investigation that was selected when you created the note but does not appear on the investigation. Retrieve draft notes by clicking the ![]() icon.
icon. 
Make changes to investigation entries
Make changes to the entries on an investigation from the list view or the timeline view.
Delete a single investigation entry from the timeline view
- Find the entry on the timeline view.
- Click Action > Delete Entry.
- Click Delete to confirm deleting the entry.
Delete investigation entries from the list view
- Click List to view the investigation as a list of entries.
- Select the check box next to the investigation entries that you want to delete.
- Click Action and select Delete.
- Click Delete to confirm deleting the entry.
Change a note
- Find the note in the investigation and open the note for editing.
- From the timeline view of the investigation click Action > Edit Note
- From the list view of the investigation click Edit in the Actions column.
- Make changes. For example, add a new attachment and add a sentence to the description describing the new attachment.
- Remove a file attachment by clicking the X next to the file name.
- Click Save.
Close an investigation
You can indicate that na investigation is closed in several ways.
- Change the title to include the word "Closed" so that you can filter on closed investigations on My Investigations.
- Add a note at the end of the investigation to identify the investigation as closed.
Change the title and description of an investigation
You can also change the title and description of an investigation. For example, change the name of the investigation as your investigation progresses to more accurately describe the security incident you are investigating.
- From the investigation bar, click the
 icon. From the investigation view, click Edit.
 - Change the title or description.
- Click Save.
Run a quick search from the investigation bar
Run a search without opening the search dashboard by clicking Quick Search ![]() on the investigation bar.
on the investigation bar.
- Add the search to the investigation in the investigation bar by clicking Add to Investigation.
- Use the Event Actions to add specific events in the search results to an investigation.
- To save the search results at investigation time, click Export to export the search results as a CSV file. Add the search results as an attachment to a note on the investigation.
- Click Open in Search to view the search results on the Search dashboard.
- Enlarge or shrink your view of the search results by clicking and dragging the corner of the window. Double click to expand the search view to cover most of your screen, or double click again to shrink it.
Collaborate with another analyst
You can collaborate with other analysts on an investigation.
Add a collaborator to an investigation
- Open the investigation that you want to add a collaborator to.
- Click the
 icon.
icon. - Type the name of the person you want to add and select their name from the list to add them to the investigation.
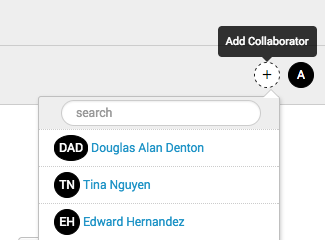
- Their initials appear in a circle to confirm that they were added.

You can add any Splunk user in your deployment as a collaborator. By default, a collaborator has write permissions on the investigation.
View the collaborators assigned to an investigation
You can view the collaborators assigned to an investigation from an individual investigation or from the Investigations dashboard.
- Hover over the collaborator icons to see the names of the collaborators on your investigation.
- If a collaborator does not have write permissions for an investigation, the icon is gray and (read-only) is appended to their name.
- Click the icon of a collaborator to see information about them. See their name and the permissions that the user has for the investigation.

Make changes to the collaborators on an investigation
If you are a collaborator on an investigation with write permissions, you can change the permissions of other collaborators on the investigation.
- Click the icon of a collaborator.
- Change the Write permissions. By default, all collaborators have Yes for Write permissions. All investigations must have at least one collaborator with write permissions.
You can remove a collaborator if they are not the only collaborator on the investigation with write permissions.
- Click the icon of a collaborator.
- Click Remove.
Review an investigation
Revisit past investigations, or view a current investigation by clicking the title from the investigation bar or from the Investigations dashboard. Users with the capability to manage all investigations can view all investigations. Only collaborators on an investigation with write permissions can edit an investigation. See Access to investigations.
Review an investigation for training or research purposes. Click an entry on an investigation to see all details associated with it.
- For notes with file attachments, click the file name to download the file attachment.
- For notable events, click View on Incident Review to open the Incident Review dashboard filtered on that specific notable event.
- For action history entries, you can repeat the previously-performed action. For a search action history entry, click the search string to open it in search. For a dashboard action history entry, click the dashboard name to view the dashboard.

Gain insight into an attack or investigation by viewing the entire investigation timeline or view only part of it by expanding or contracting the timeline.

Click the timeline to move it and scan the entries. View a chronological list of all timeline entries by clicking the list icon, or refine your view of the timeline using filters. You can filter by type or use the Filter box to filter by title.
To share an investigation with someone that does not use , such as for auditing purposes, you can print any investigation or save any investigation as a PDF.
- From the investigation, click the
 icon. generates a formatted version of the investigation timeline with entries in chronological order.
 - Print the investigation or save it as a PDF using the print dialog box options.
Example investigation workflow
- You are notified of a security incident that needs investigation through a notable event, an alert action, or by an email, ticket from the help desk, or a phone call.
- Create an investigation in .
- If you must work with someone else on the investigation, add them as a collaborator.
- Investigate the incident. While you investigate, add helpful or insightful steps to the investigation.
- Run searches, adding useful searches to the investigation from your action history with the investigation bar or relevant events using event actions. This makes it easy to replicate your work for future, similar investigations, and to make a comprehensive record of your investigation process.
- Filter dashboards to focus on specific elements, like narrowing down a swim lane search to focus on a specific asset or identity on the asset or identity investigator dashboards. Add insightful filtering actions from your action history to the investigation using the investigation bar.
- Triage and investigate potentially related notable events. Add relevant notable events to the investigation.
- Add notes to record other investigation steps, such as notes from a phone call, email or chat conversations, links to press coverage or social media posts. Upload files like screenshots or forensic investigation files.
- Complete the investigation and add a note to record a summary of your findings.
Your action history
While you investigate an attack or other security incident, actions that you take in are recorded in your action history. You can only view your own entries in your action history. After you add an item to an investigation, all collaborators on the investigation can view that entry.
Your action history tracks the following types of actions using saved searches:
- Dashboards you visit
- Searches you run
- Per-panel filtering actions you take
- Changes you make to a notable event
- Changes you make to the suppression filters of a notable event
See Data sources for investigations.
tracks these actions to help you add context to an investigation, audit an investigation, and give a complete history of actions taken during an investigation that resulted in relevant findings. For example, if you run a search that gives helpful information for an investigation, you can add that search to the investigation. You can then find that search string in the investigation, run the search again, or revisit a search to save it as a report when the investigation is over.
|
PREVIOUS Included adaptive response actions with |
NEXT Manage security investigations in |
This documentation applies to the following versions of Splunk® Enterprise Security: 4.6.0 Cloud only
Feedback submitted, thanks!