Monitor Splunk APM billing and subscription usage 🔗
Note
Use this topic to understand general aspects of subscription usage for Splunk APM. For more detailed billing-related questions, contact your Splunk Account Team.
The following table lists the Splunk APM billing and subscription usage information that is available for you to use to monitor your organization usage against its subscription plan and limits.
Subscription usage information |
Location |
Link to documentation |
|---|---|---|
Type of plan |
APM subscription usage page |
|
|
APM subscription usage page |
|
Subscription limits for your subscription plan |
APM subscription usage page |
|
Usage metrics for host subscription plans |
Detailed usage reports |
|
Usage metrics for trace-analyzed-per-minute (TAPM) subscription plans |
Detailed usage reports |
|
Host and container diagnostics |
Host and container diagnostic report |
|
Expensive services, most-used tag values, and largest ingested traces |
Trace and span statistics |
Use the trace and span statistics to understand increases in usage |
Throttling and limits metrics |
APM throttling dashboard |
Use the APM throttling and entitlement dashboards to better understand your usage |
Historical subscription usage metrics data |
APM entitlements dashboard |
Use the APM throttling and entitlement dashboards to better understand your usage |
Prerequisite 🔗
To view the APM subscription usage page, you must have the admin or usage role.
View APM subscription usage 🔗
To view your APM subscription usage, follow these steps:
In Splunk Observability Cloud, go to Settings and then Subscription Usage or Billing and Usage, depending on your organization subscription.
Select the APM tab.
Select the average usage panels to see per-minute data.
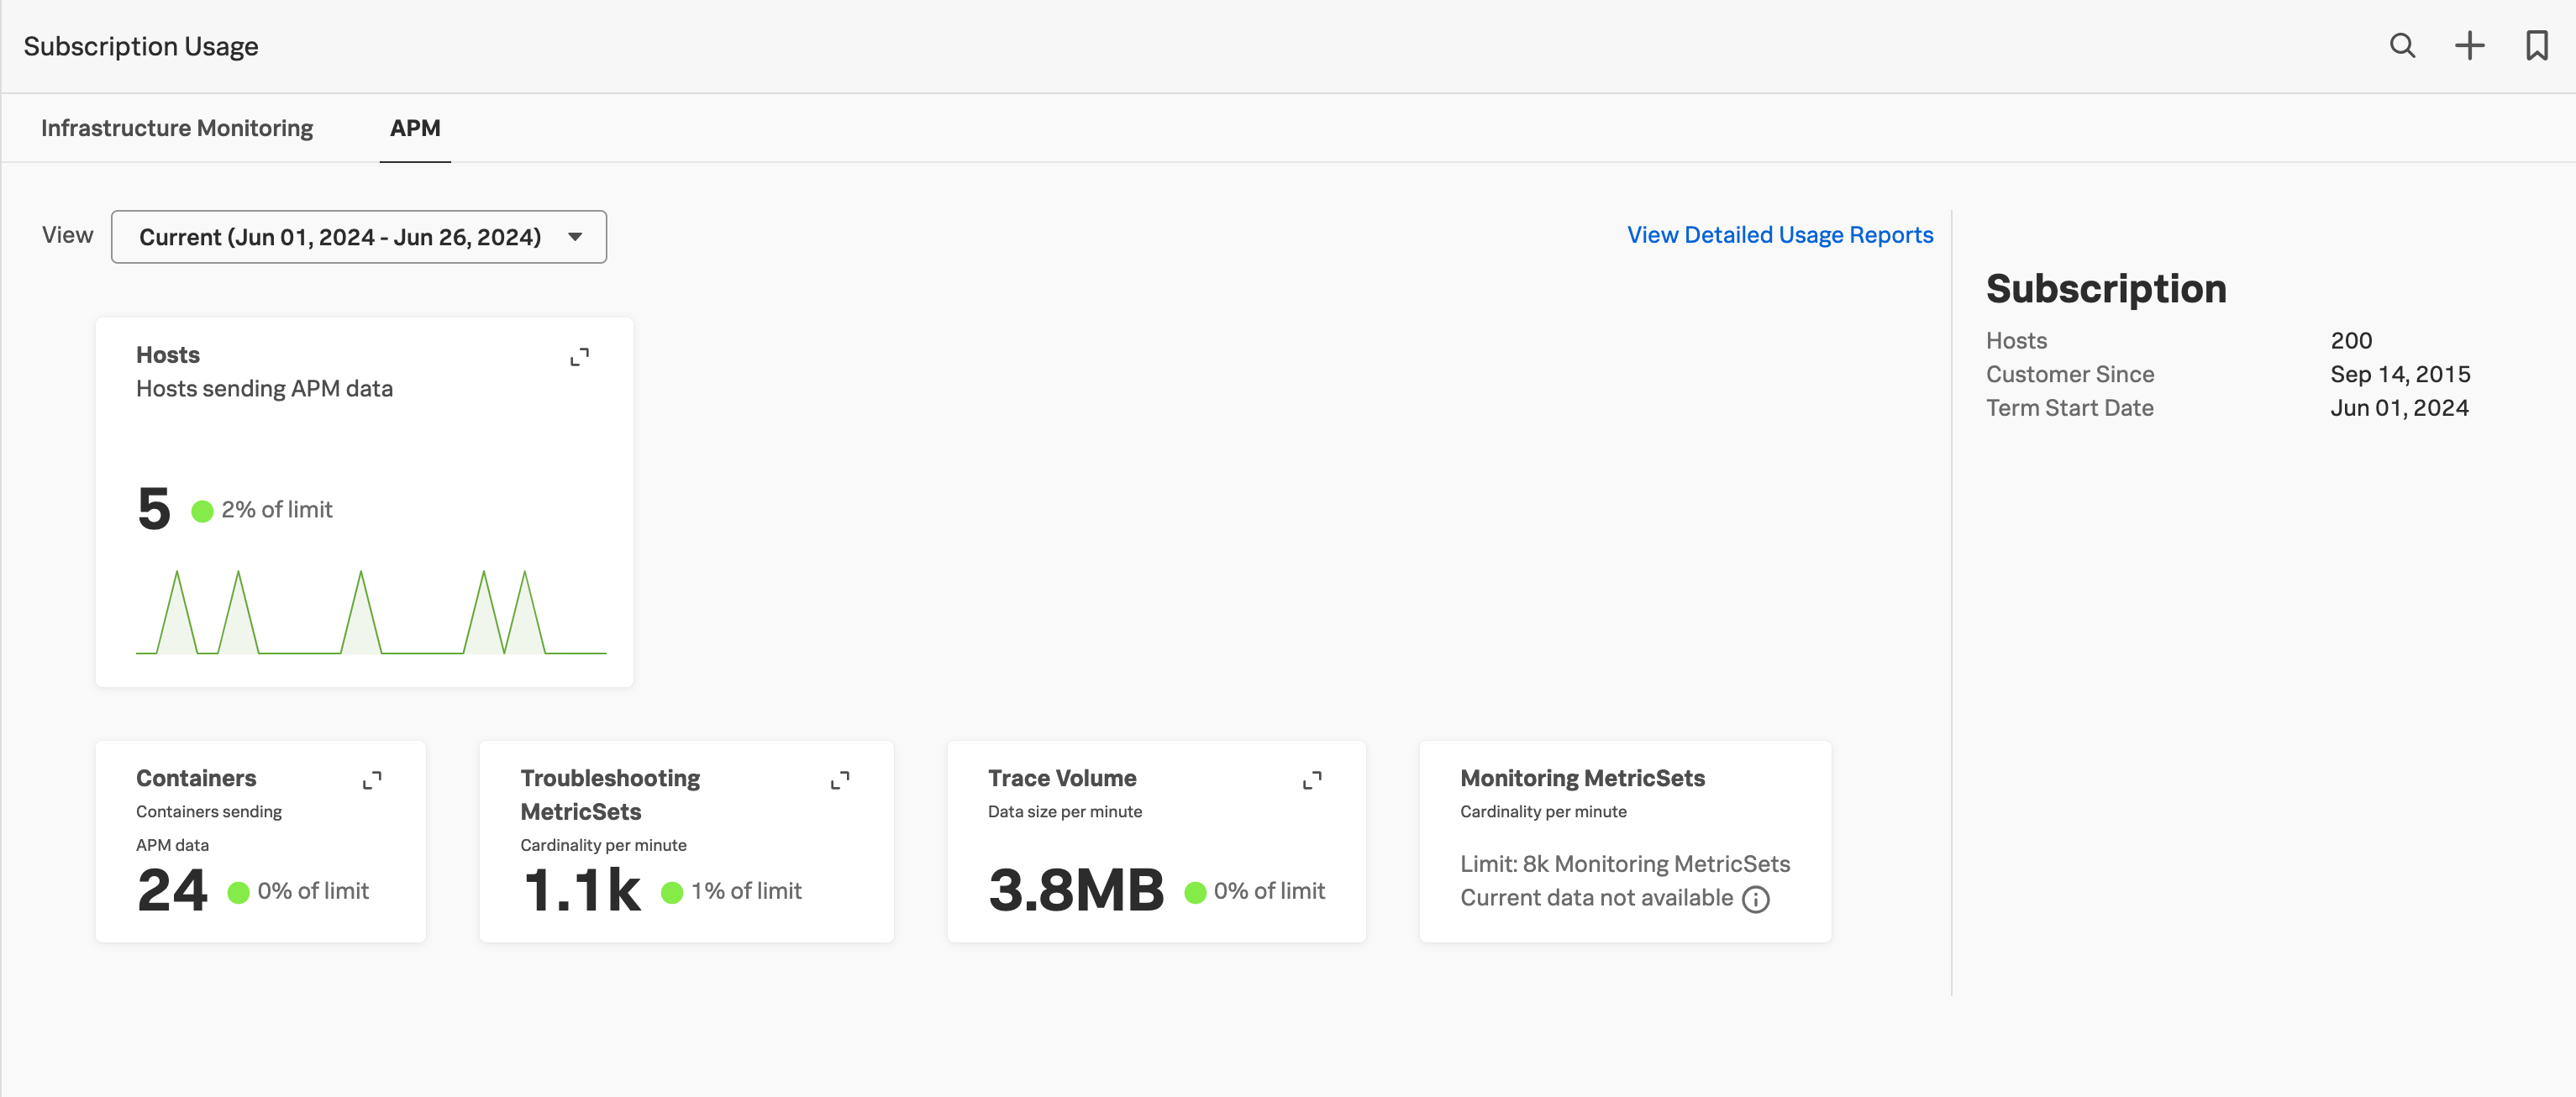
The subscription usage page displays the following information about your organization’s usage:
The type of plan
- The average usage and the percent of limit for the following aspects of Splunk APM. The average is also the monthly billed value.
Hosts, for host subscription plans
Containers, for host subscription plans
Troubleshooting MetricSets
Trace volume
Monitoring MetricSets
The subscription limits for your subscription plan. Select a panel to access subscription limit information.
Note
The APM subscription usage page displays a panel for Monitoring MetricSets (MMS), but the metric that powers the chart is not available on the subscription usage page. Select View Detailed Usage Reports to view your current histogram MMS data. For more information about detailed usage reports, see Download detailed usage reports.
For questions about subscription usage, contact tech support or your sales representative.
The following image shows the APM subscription usage page for a host subscription plan.
Download detailed usage reports 🔗
Download detailed usage reports for recent usage periods to better understand your usage. APM usage reports are available as tab-delimited text files. They include metrics and subscription usage for the entire usage period. Follow these steps to view and download a usage report:
In Splunk Observability Cloud, go to Settings then Subscription Usage or Settings then Billing and Usage depending on your organization subscription.
Select the APM tab.
Select View Detailed Usage Reports.
Select the usage report for the usage period you want to analyze. The usage report opens in a new tab.
To download the report, select the usage report and save it as a .txt file.
Usage report metrics for host subscription plans 🔗
Usage reports for host subscription plans include the following information about your organization usage:
The number of billed hosts. Host data is available per minute.
The number of billed containers. Container data is available per minute.
The billed trace volume. Trace volume data is available per minute.
The number of billed Troubleshooting MetricSets (TMS). TMS data is available per minute.
The number of billed Monitoring MetricSets (MMS). MMS data is available only for histogram MMS and is available only in the usage report. MMS data is available at 10-minute intervals.
The average number of hosts. Averages are available in usage reports for complete months only.
The average number of containers. Averages are available in usage reports for complete months only.
The average number of Troubleshooting MetricSets. Averages are available in usage reports for complete months only.
The average number of Monitoring MetricSets. Averages are available in usage reports for complete months only.
The average trace volume in bytes. Averages are available in usage reports for complete months only.
Note
To generate and download subscription usage reports for your hosts and containers, see Download a host and container diagnostic report.
Usage report metrics for trace-analyzed-per-minute (TAPM) subscription plans 🔗
Usage reports for TAPM subscription plans include the following information about your organization usage:
The number of billed TAPM. TAPM data is available per minute.
The billed trace volume. Trace volume data is available per minute.
The number of billed Troubleshooting MetricSets (TMS). TMS data is available per minute.
The number of billed Monitoring MetricSets (MMS). MMS data is available only for histogram MMS and is available only in the usage report. MMS data is available at 10-minute intervals.
The average number of TAPM. Averages are available in usage reports for complete months only.
The average number of Troubleshooting MetricSets. Averages are available in usage reports for complete months only.
The average number of Monitoring MetricSets. Averages are available in usage reports for complete months only.
The average trace volume in bytes. Averages are available in usage reports for complete months only.
Download a host and container diagnostic report 🔗
For host subscription plans, you can download reports that show which hosts and containers are sending APM data over a specific minute. Use this report to identify which hosts and containers are contributing to your subscription usage. You can generate and download reports within the retention period for traces. See Data retention in Application Performance Monitoring (APM) for more information.
To download a subscription usage report, do the following steps:
Go to then .
Select the APM tab.
Expand the Hosts chart or the Containers chart.
Select an hour of time in the chart within the retention period for traces.
Select a specific minute within the hour.
If you’ve selected a minute that falls within the trace retention period, the Download Data becomes active and displays the minute you selected. Select the download button to download the .csv file.
The following GIF shows the steps to download a subscription usage report.
For each selected minute, the report shows the attributes or tags associated with the hosts and containers that sent data to Splunk APM. You might see different tags, like AWSUniqueId, container_id, gcp_id, and so on, depending on the source of the host or container observed and the version of your instrumentation agent.
Caution
For Kubernetes deployments, the Kubernetes attributes processor extracts default attributes, such as k8s.pod.name. These attributes are required for accurate subscription usage. Don’t remove the Kubernetes attributes processor from your configuration. See Kubernetes attributes processor for more information.
Use the trace and span statistics to understand increases in usage 🔗
Use Usage Analyzer at the bottom of the page to understand increases in your usage data. Specifically, the usage analyzer can help you determine your most expensive services, your most-used tag values, and your largest ingested traces.
The Spans per minute and Trace volume charts show span and trace volume ingested at 2-hour intervals for the last 8 days. Select a 2-hour bar within either chart to see data tables for Services by span count, Tags by total size, and Traces with most spans for the midpoint minute within the 2-hour interval.
Use this data to troubleshoot and create a plan to mitigate sudden increases in your APM usage data.
Use the APM throttling and entitlement dashboards to better understand your usage 🔗
Select Dashboards.
Search for “APM entitlements” or “APM throttling” to access the APM entitlements and APM throttling dashboards to further examine your usage.
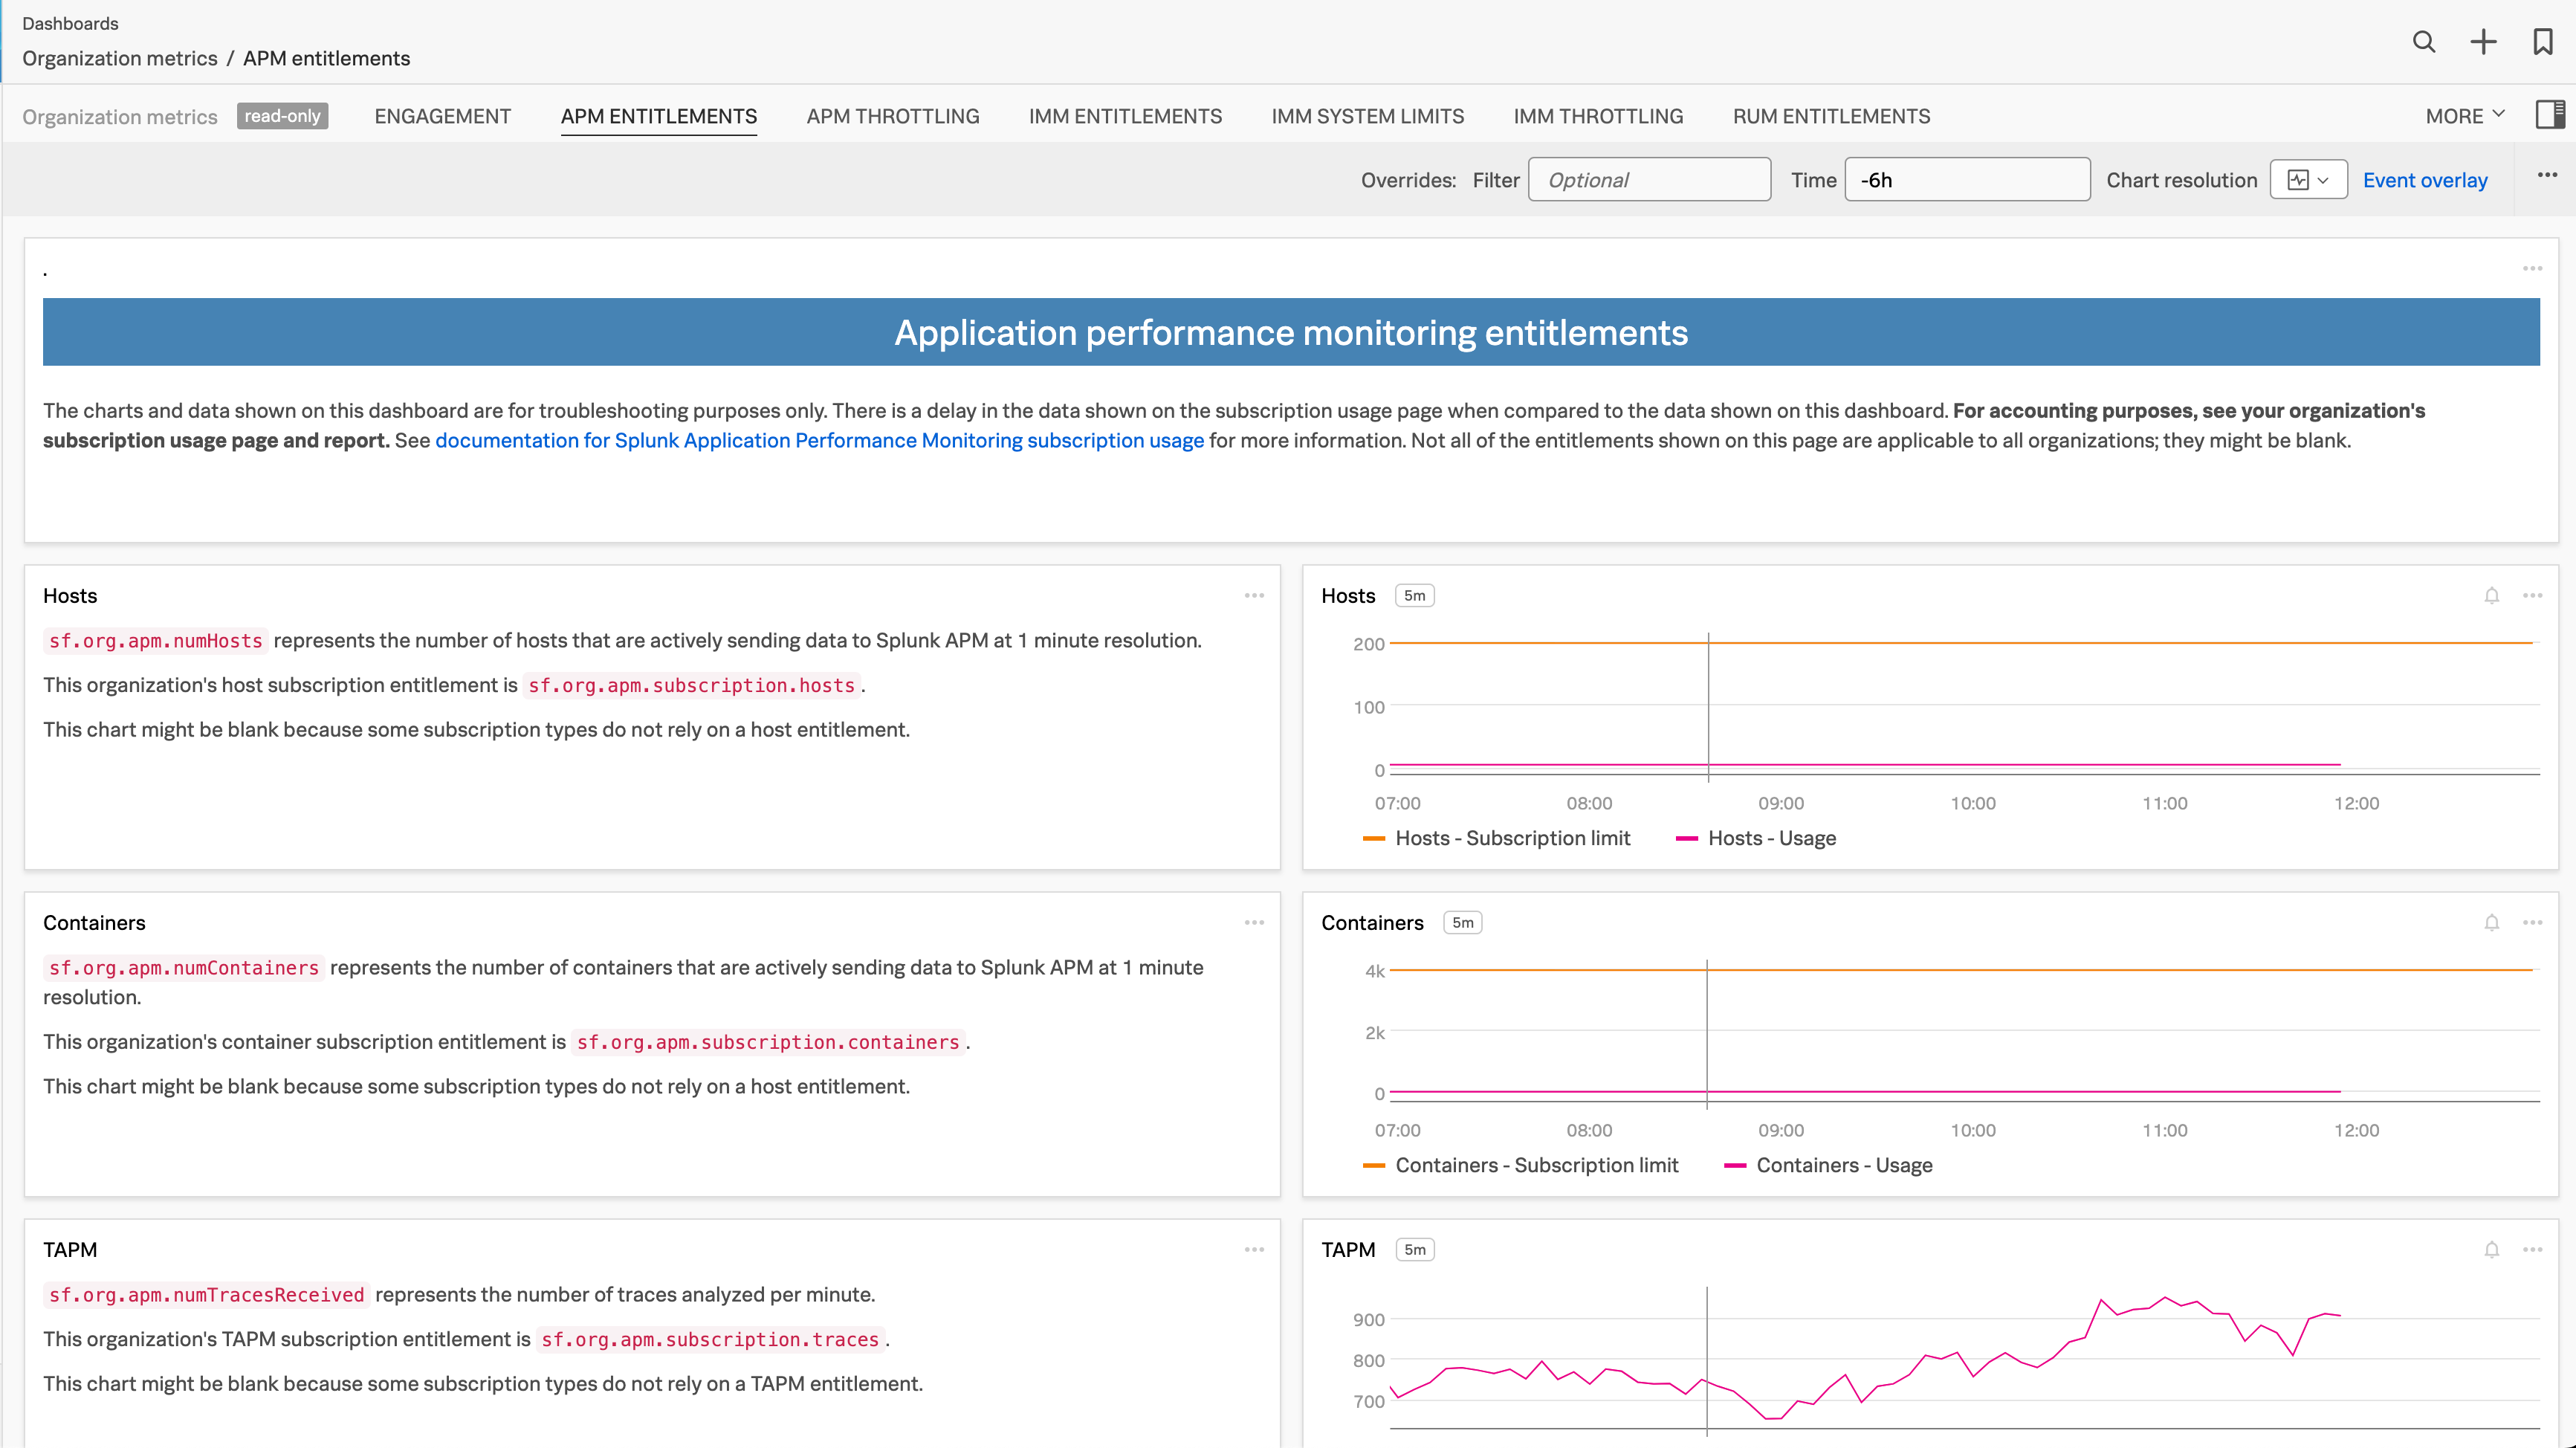
The APM entitlements dashboard provides historical data for metrics used on the Subscription Usage page.
The following image shows the APM entitlements dashboard.
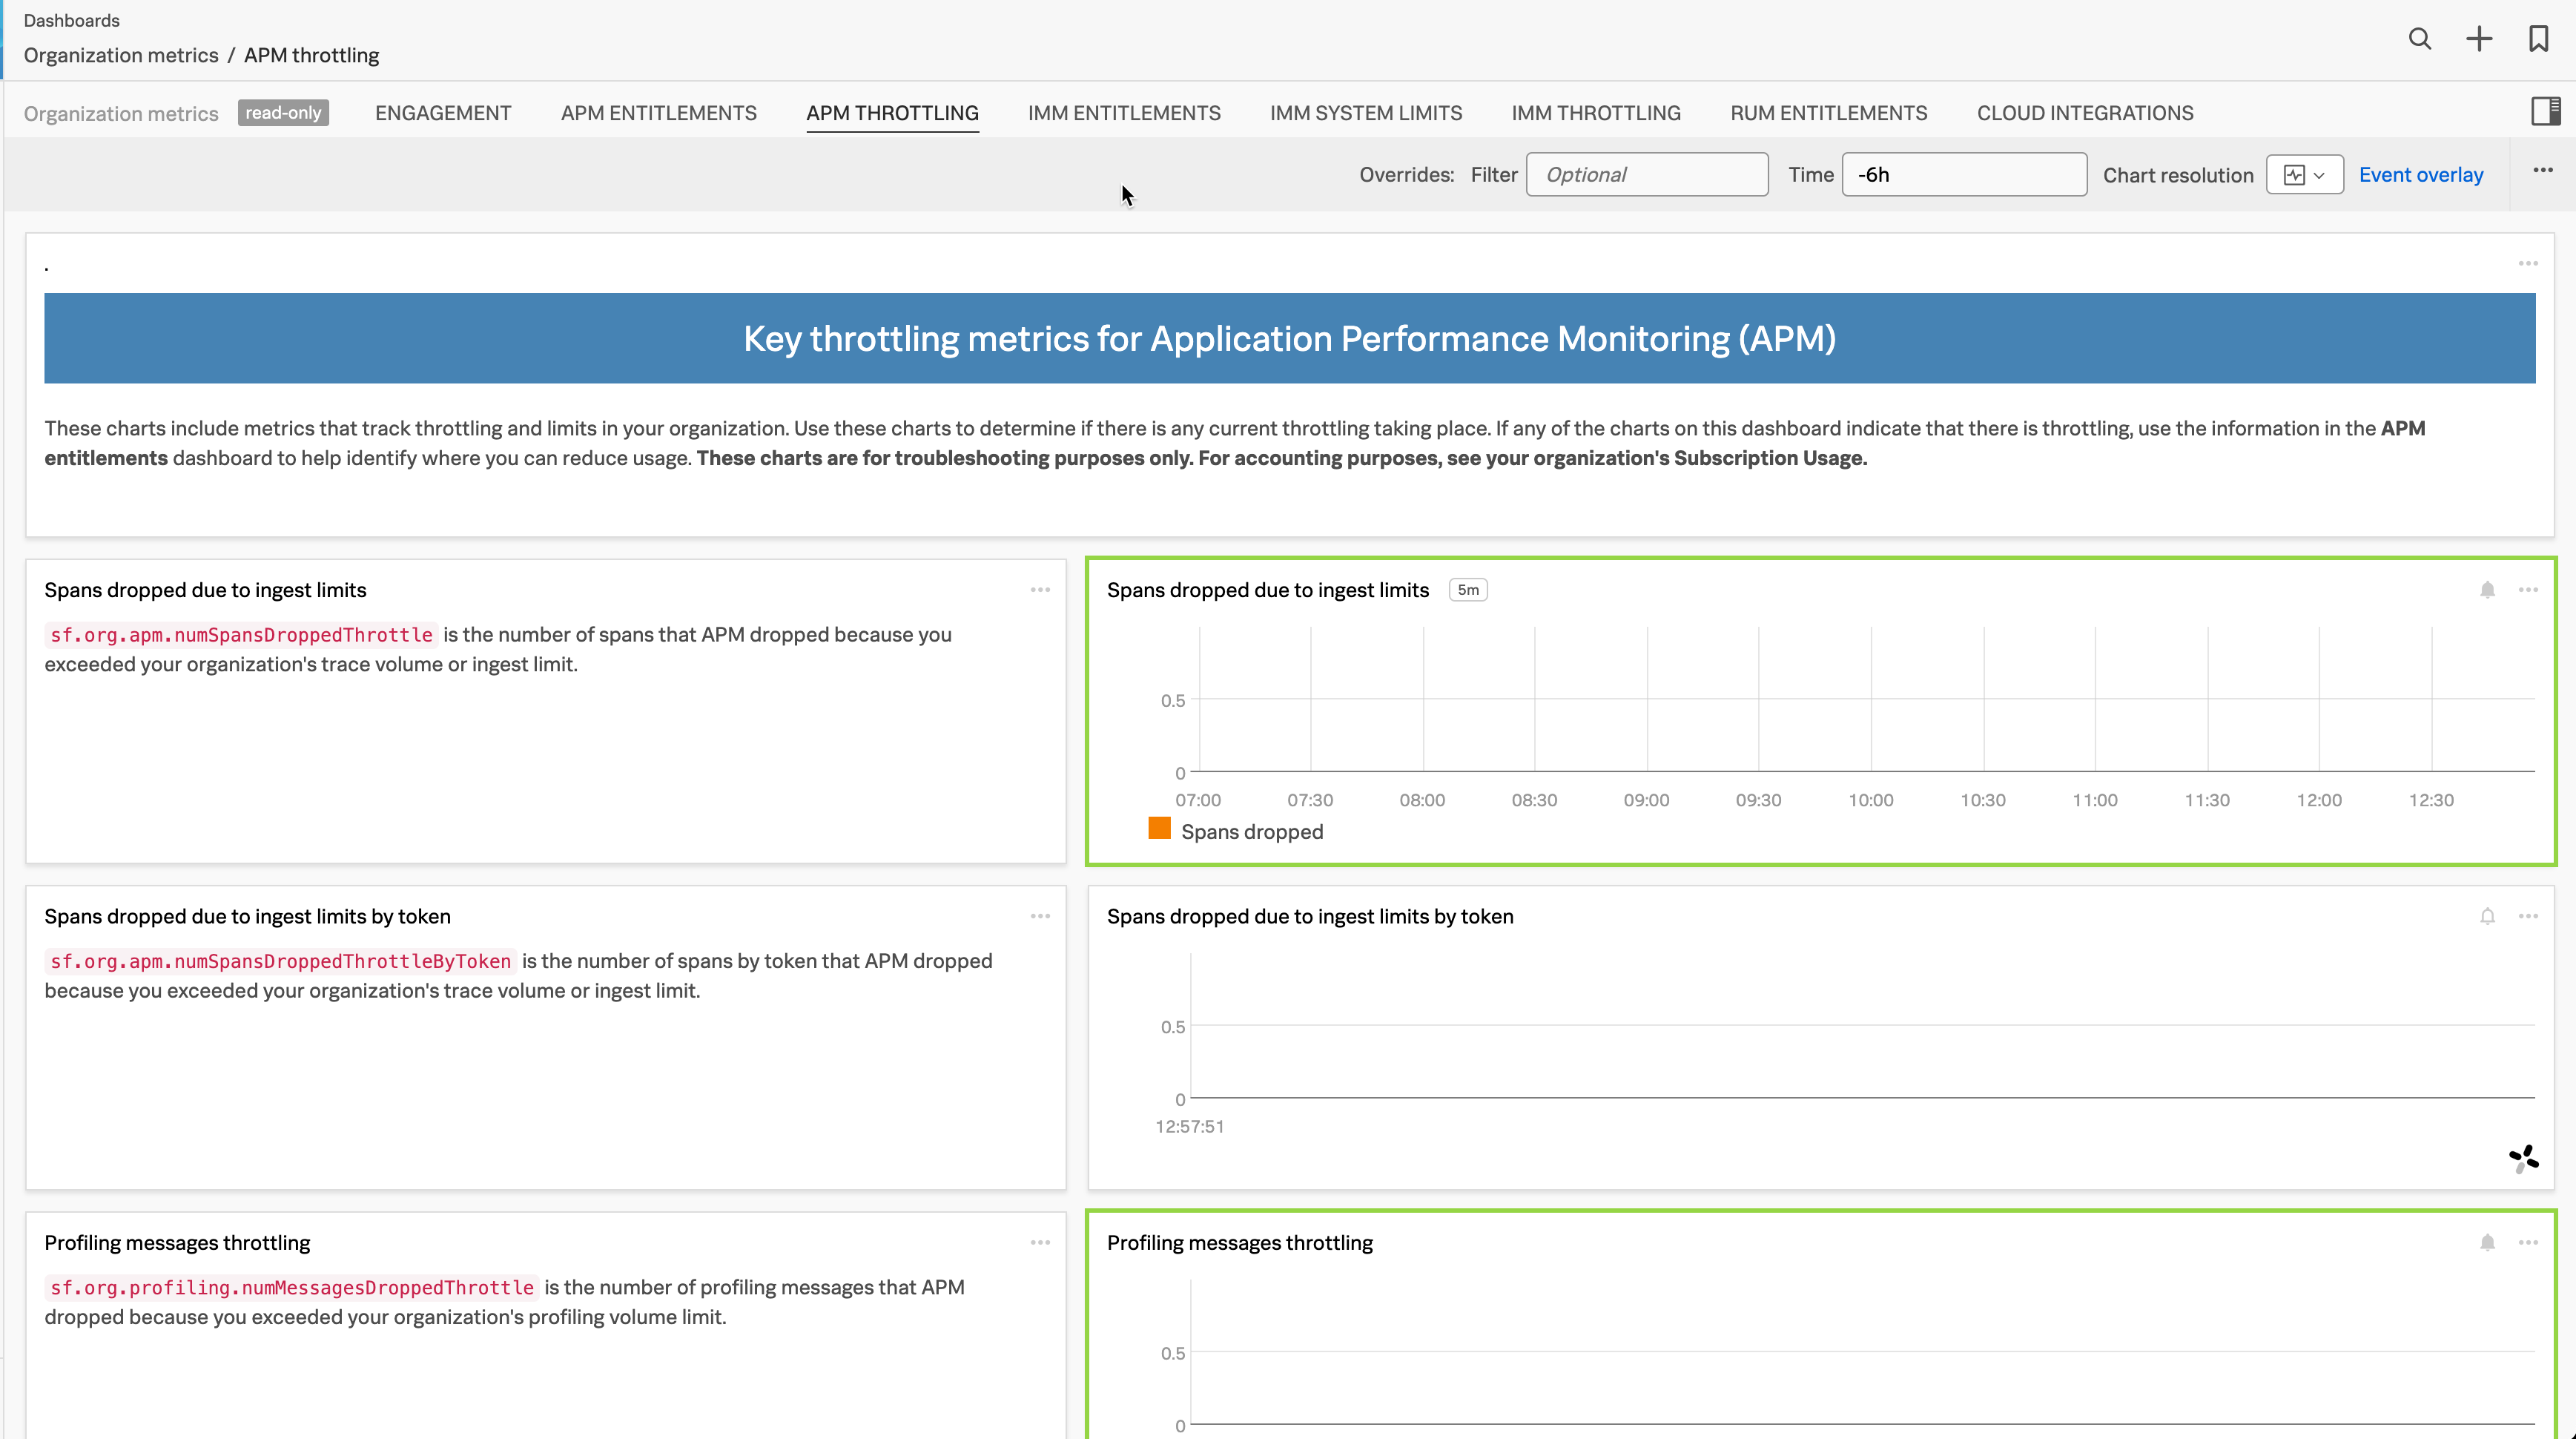
The APM throttling dashboard includes metrics that track throttling and limits in your organization. Several metrics in the APM throttling dashboard have detectors set up to send alerts when metrics for your organization are being throttled.
The following image shows the APM throttling dashboard.
How APM calculates usage 🔗
APM uses Splunk Observability Cloud metrics to calculate usage for traces-analyzed-per-minute (TAPM) and host subscription plans. Limits for host subscription plans are based on the number of hosts and containers sending data to APM. Limits for TAPM subscription plans are based on the number of traces you send to APM per minute.
APM provides a value for each usage metric the system collects for each subscription usage period. Use the charts on the APM Subscription Usage page that plot these metrics so you can monitor the billed value for each metric.
See the following sections for more information about how APM calculates usage for each subscription plan type. To confirm the plan for your organization, view the Subscription panel on the Subscription Usage page.
The following sections detail the metrics for TAPM and host subscription plans respectively.
Metrics for TAPM subscription plans 🔗
The following metrics power the charts in your APM Subscription Usage page with a TAPM subscription plan:
Metric |
Chart |
Description |
|---|---|---|
|
TAPM |
The number of traces Splunk APM receives and processes. |
|
Trace Volume |
The number of bytes Splunk APM accepts from ingested span data after decompression and discarding invalid and throttled spans. |
|
Troubleshooting MetricSets |
The cardinality of Troubleshooting MetricSets for each 1-minute window. |
|
Monitoring MetricSets |
The cardinality of Monitoring MetricSets for each 10-minute window. |
Metrics for host subscription plans 🔗
The following metrics power the charts in your APM Subscription Usage page with a host subscription plan:
Metric |
Chart |
Description |
|---|---|---|
|
Hosts |
The number of hosts that are actively sending data to Splunk APM. |
|
Containers |
The number of containers actively sending data to Splunk APM. |
|
Trace Volume |
The number of bytes Splunk APM accepts from ingested span data after decompression and discarding invalid and throttled spans. |
|
Troubleshooting MetricSets |
The cardinality of Troubleshooting MetricSets for each 1-minute window. |
|
Monitoring MetricSets |
The cardinality of Monitoring MetricSets for each 10-minute window. |
To see all of the organization metrics for APM, see View organization metrics for Splunk Observability Cloud.