Analyze the performance of inferred services 🔗
In certain cases, a remote service might not have tracing turned on, either because it is not instrumented yet, or because instrumentation is not possible. Splunk APM can infer the presence of the remote service, or inferred service, if the span calling the remote service has the necessary information.
Splunk APM adds an inferred span to the relevant trace to represent an operation occurring in an inferred service. For further details on how Splunk APM infers services, see How does Splunk APM identify inferred services?.
The following table describes common types of inferred services:
Type |
Example |
Notes |
|---|---|---|
Generic service
(dotted circle in the service map)
|
AWS service |
This service type includes external service providers, generic remote procedure calls (RPCs), and HTTP services. See the following sections to learn more about each of these types:
If your system interacts with a large number of HTTP services, inferring HTTP services might increase the cardinality of your Troubleshooting MetricSets (TMS). If so, you might turn off inferring HTTP services in your org to prevent excessive cardinality. See Manage inferring HTTP services to manage inferred HTTP services.
|
Publisher/subscriber queues (pub/sub)
(dotted arrow in the service map)
|
Kafka, Kinesis |
To learn more about inferred pub/sub queues, see Inferred publisher/subscriber (pub/sub) queues. |
Database
(dotted cylinder in the service map)
|
MySQL, AWS S3, Redis, MongoDB |
In addition to the details described in What information about inferred services is available?, Splunk APM provides additional analytics for inferred SQL databases. See Monitor Database Query Performance to learn more about database insights in Splunk APM. |
What information about inferred services is available? 🔗
Because inferred services are not instrumented, Splunk APM only has access to spans from instrumented services that call inferred services. Splunk APM places inferred services in their inferred locations in the service map and provides Troubleshooting MetricSets (TMS), or request, error, and duration (RED) metrics, based on the associated client-side spans. You can continue to troubleshoot with these metrics in Tag Spotlight. If the inferred service is servicing other uninstrumented services, these reported RED metrics might not provide a complete picture of the inferred service’s interactions.
Viewing inferred services in the service map 🔗
Inferred services, pub/subs, and databases appear in their inferred locations in the service map. When you select on an inferred service in the service map, you can view its service type, service names, and request, error rate, and latency (RED) metrics. Metrics are based on referring spans from instrumented services and might not provide a complete picture of the inferred service’s interactions.
Viewing inferred services in trace view 🔗
Inferred services, pub/subs, and databases also appear as spans in the Trace Waterfall view. They appear in a gray box with italicized print, as in the following screenshot:
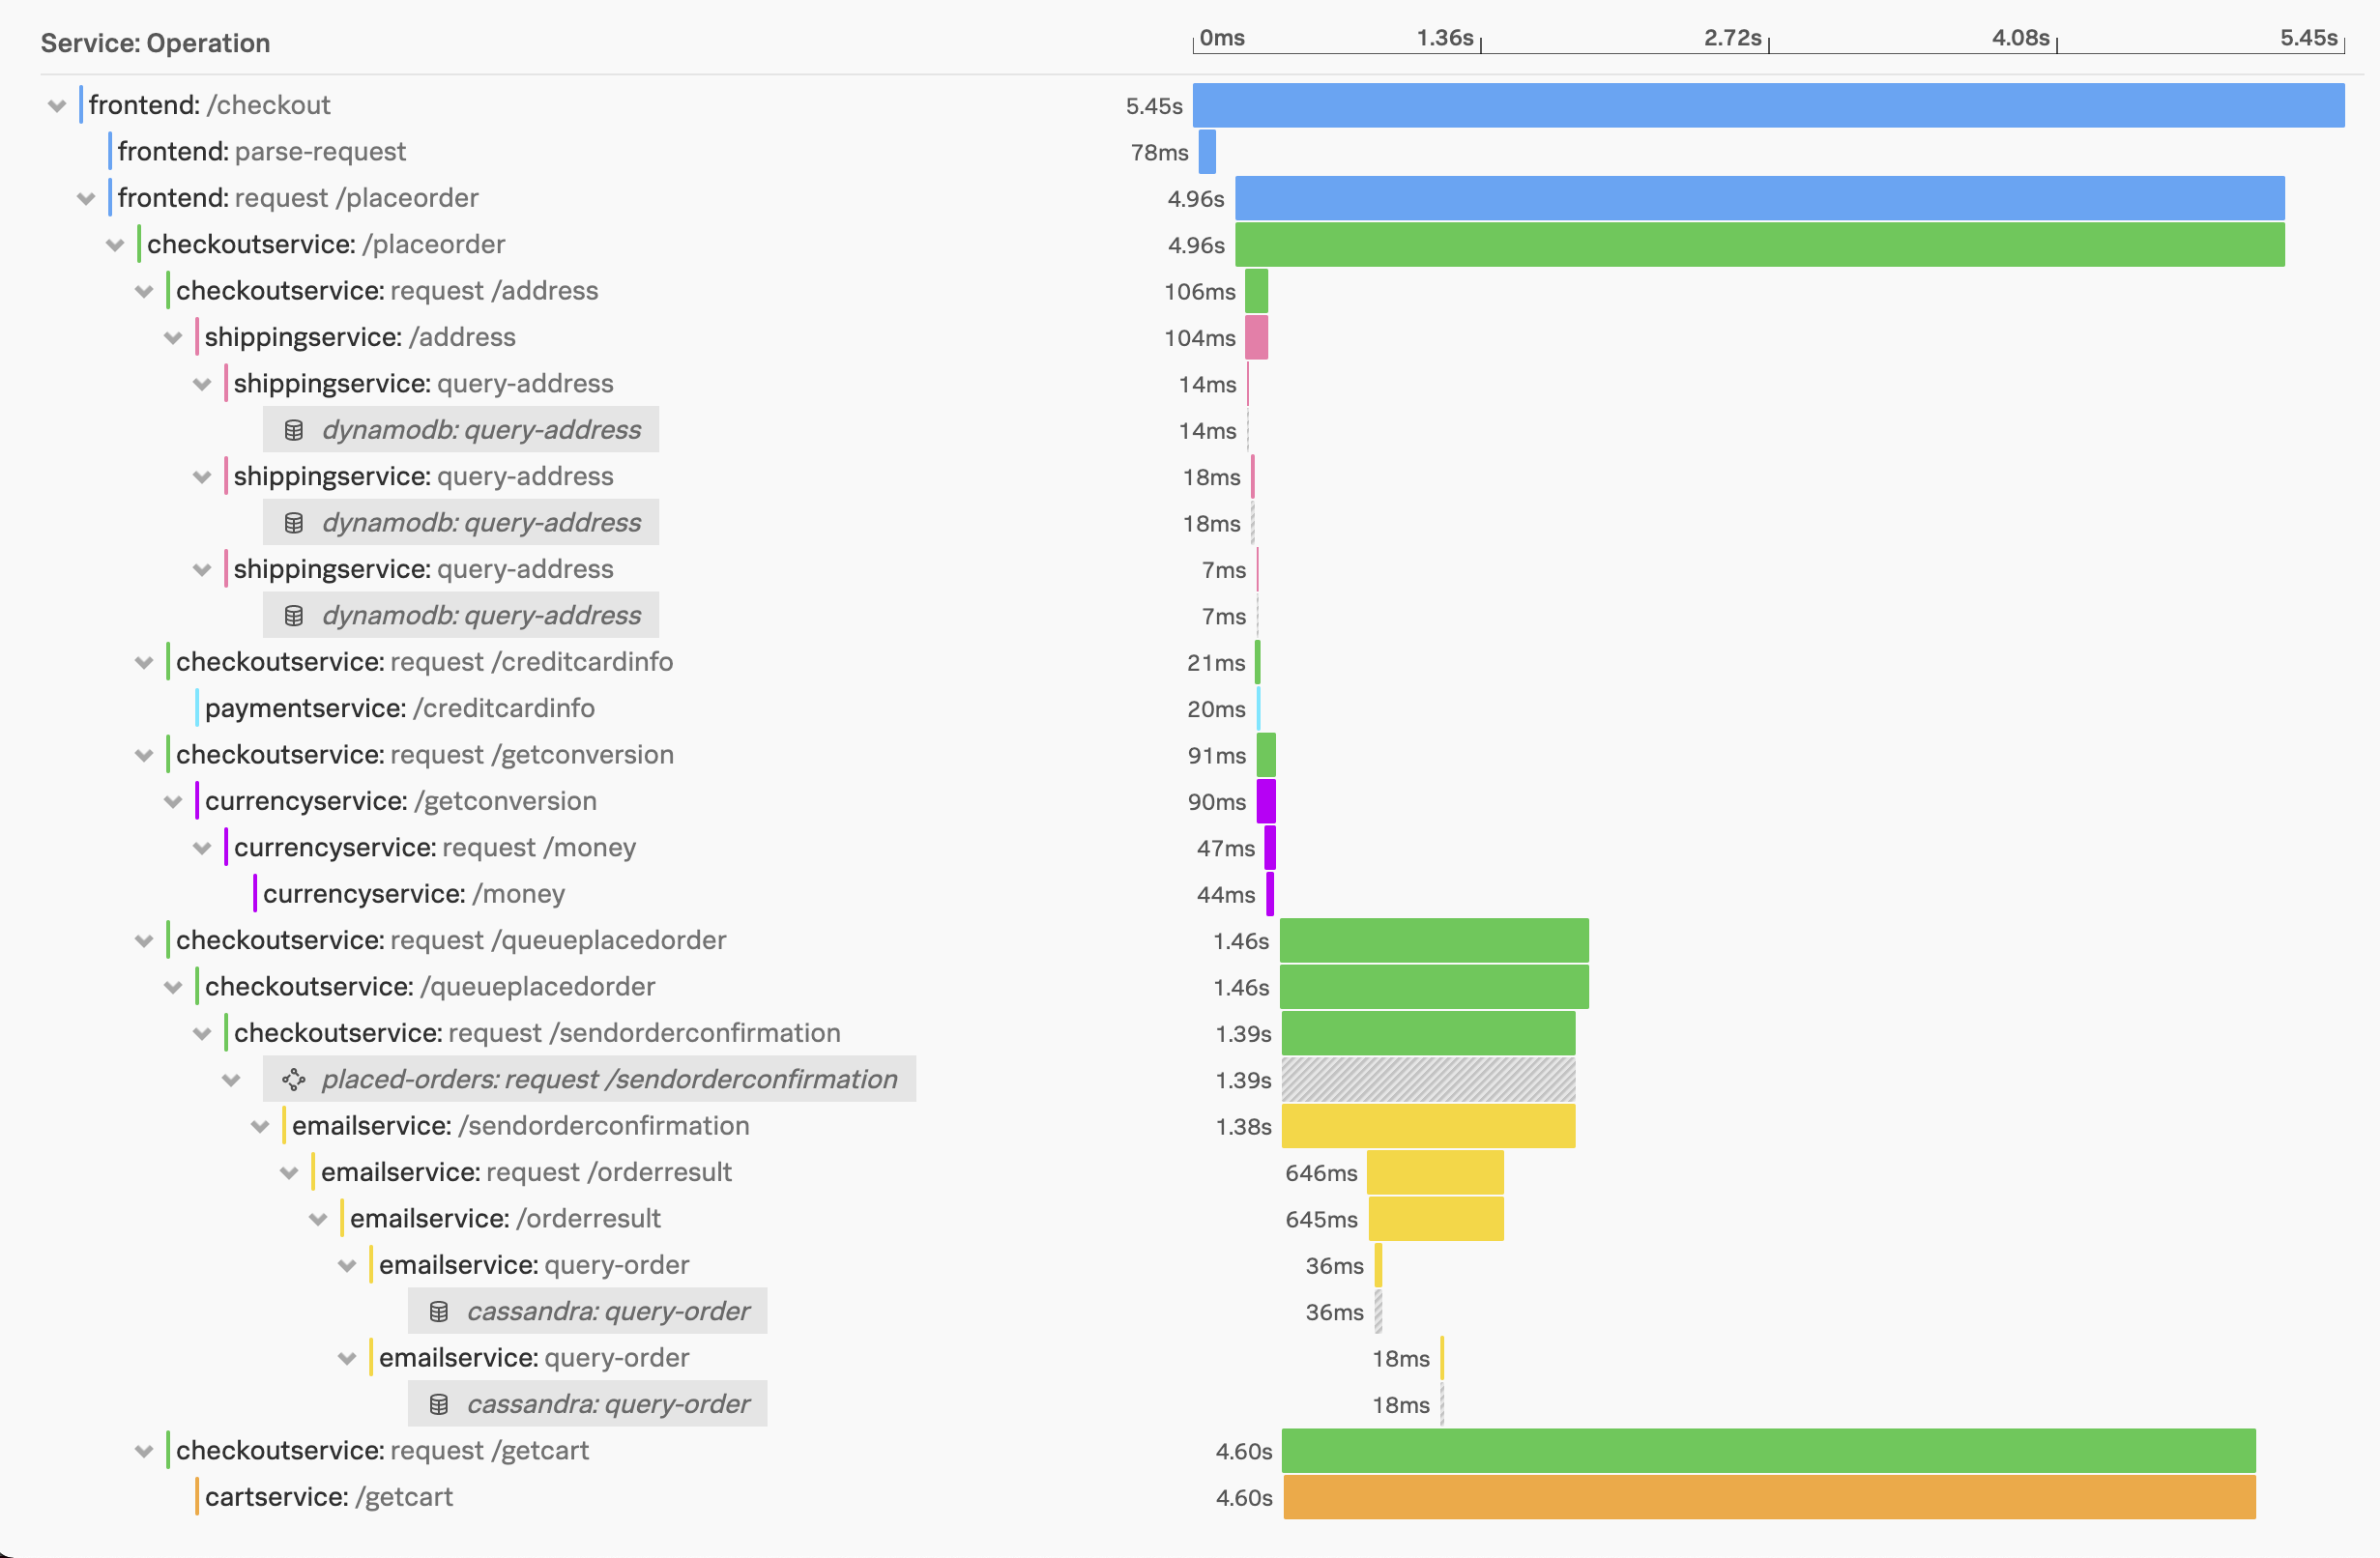
When you select an inferred span in the Trace Waterfall, it expands to show the metadata of the corresponding parent span. The length of the operation represented as the gray striped bar in the waterfall visualization is also inherited from the parent span and might not be exactly representative of the operation duration in the inferred service.
Create Monitoring MetricSets to chart and alert on inferred services 🔗
Note
Only third-party or un-instrumented HTTP services are supported for Monitoring MetricSets.
You can create a Monitoring MetricSet (MMS) for inferred services. Use MMS to chart inferred service metrics in dashboards and create detectors to alert on your inferred services. See Create a Monitoring MetricSet with a custom dimension for an inferred service.
How does Splunk APM identify inferred services? 🔗
When a client or producer span doesn’t have a corresponding server span, Splunk APM checks whether the unpaired span contains tags that indicate interaction with an uninstrumented service.
To identify an inferred service, Splunk APM first checks for tags that indicate the type of the inferred service, and then checks for tags that indicate the service name. After Splunk APM identifies a client or producer span with a tag or tags that indicate interaction with 1 of these service types, it creates an inferred span to represent the operation in the uninstrumented service.
The table in Types of inferred services and how they’re inferred provides a list of types of inferred services and the tags and the inference methods that Splunk APM uses to identify each type of inferred service. In the case of inferred pub/sub services, the inferred span inherits the metadata from the corresponding client or producer span and is attached directly to that span.
For inferred service types other than pub/sub, Splunk APM applies additional logic to ensure it captures only the most important application-level information. If there are multiple client spans without a corresponding server span, the inferred span inherits the metadata from the parent-most of these client spans. The inferred service span is then attached to the most recent of these client spans. Otherwise, if there is a single client span without a corresponding server span, the inferred span inherits the metadata from that client span and is attached to that same span.
Manage inferring HTTP services 🔗
You can configure Inferring HTTP services to control over inferred services appear in the service map and generate Troubleshooting MetricSets.
The advantage of inferring HTTP services is that you have visibility into their interactions with instrumented services. The potential downside is that if there are a lot of different HTTP services called from your system, they might crowd the service map and increase TMS cardinality.
Splunk APM administrators can manage inferred HTTP services in the APM Configuration, providing flexibility based on your particular system.
Prerequisite 🔗
To configure inferred HTTP services, you must have an admin role.
Configure Splunk APM to infer HTTP services 🔗
Follow these steps to configure inferred HTTP services in Splunk APM:
From the Splunk APM Landing page, select APM Configuration and select APM Service & Traces from the menu. The APM Services & Traces page opens.
Under Inferred services, find the row for Inferred HTTP service and select Configure. The configuration dialog box opens.
In the Configure Inferred HTTP Services configuration dialog box, select Infer HTTP services.
Save your changes.
Note
Inferring HTTP services generates Troubleshooting MetricSets for each new inferred service and therefore increases Troubleshooting MetricSet cardinality. Select Subscription Usage to view your current cardinality usage. See Troubleshoot cardinality in Monitoring MetricSets to learn more about managing cardinality.
Types of inferred services and how they’re inferred 🔗
The following table provides a list of types of inferred services and the tags and the inference methods that Splunk APM uses to identify each type of inferred service. The span tags used in these inference rules are based on OpenTelemetry semantic conventions.
Splunk APM infers the following types of services:
Inferred HTTP services 🔗
When Splunk APM infers an HTTP service, it means an instrumented service is talking to a remote HTTP endpoint.
To assign a service name for an inferred HTTP service, Splunk APM does the following:
Verifies that the
span.kindof the referring span is equal toCLIENT.- To ensure that the
peer.serviceis an HTTP service, applies the following logic: - If
peer.serviceexists and 1 or more of following also exist, the service name is extracted frompeer.service. http.hosthttp.urlin libraries that support OpenTelemetry semantic conventions version 1.16.0 or lower orurl.fullin libraries that support OpenTelemetry semantic conventions version 1.17.0 or highernet.peer.namein libraries that support OpenTelemetry semantic conventions version 1.16.0 or lower orserver.addressin libraries that support OpenTelemetry semantic conventions version 1.17.0 or higher
- If
- To ensure that the
- If step 2 is not true, looks for the service name in the following tags, in order. If any of these tags are found, infers the service name from the first appearing tag. If none of these tags are found, Splunk APM does not consider the span to be related to an inferred HTTP service.
http.host: host name extracted as-ispeer.hostname: host name extracted as-ispeer.address: host name is extracted from the URLFor libraries that support OpenTelemetry semantic conventions version 1.16.0 or lower, host name is extracted from
http.url. For libraries that support OpenTelemetry semantic conventions version 1.17.0 or higher, host name is extracted fromurl.full.For libraries that support OpenTelemetry semantic conventions version 1.16.0 or lower, host name extracted as-is from
net.peer.name. For libraries that support OpenTelemetry semantic conventions version 1.17.0 or higher, host name is extracted fromserver.address.
Note
To reduce noise in the service map and managing cardinality, Splunk APM excludes services without a host name or that use their IP address as host name. If you need to turn on IP addresses, contact your sales representative.
Inferred remote procedure call (RPC) services 🔗
When Splunk APM infers an RPC service, it means an instrumented service is making a remote procedure call.
To infer an RPC service, Splunk APM does the following:
Verifies that the
span.kindof the referring span is equal toCLIENT.Verifies that the referring span contains the
rpc.systemspan tag. This tag is used to identify the remote system, such asgrpc,java_rmi, orwcf.- Looks for the service name in the following tags, in the following order. If any of these tags are found, infers the service name from the first appearing tag. If none of these tags are found, Splunk APM does not consider the span to be related to an inferred RPC service.
rpc.serviceFor libraries that support OpenTelemetry semantic conventions version 1.16.0 or lower,
net.peer.name. For libraries that support OpenTelemetry semantic conventions version 1.17.0 or higher,server.address.rpc.system
Generic inferred services 🔗
This is a catch-all layer to infer generic services using the peer.service span tag.
To infer a generic service from a client span, Splunk APM does the following:
Verify that the
span.kindof the referring span is equal toCLIENT.Look for the service name in the
peer.servicetagIf the
peer.servicetag exists, infer the service name from it. If thepeer.servicetag doesn’t exist, the span isn’t considered to be related to a generic inferred service.
Note on AWS services: To identify AWS services, the span must contain http.url. Splunk APM applies heuristics on this tag’s value to determine the AWS Service type from the URL.
Inferred publisher/subscriber (pub/sub) queues 🔗
When Splunk APM infers a publisher/subscriber queue, it means an instrumented service is interacting with an uninstrumented pub/sub. To identify an inferred pub/sub, Splunk APM does the following:
Verifies that the
span.kindof the referring span is equal toPRODUCERorCLIENT.Verifies that the span contains either
messaging.destination(in libraries that support OpenTelemetry semantic conventions version 1.16.0 or lower) ormessaging.destination.name(in libraries that support OpenTelemetry semantic conventions version 1.17.0 or higher). The value of these tags is used to specify the name of the topic or channel that messages are sent to.If both
messaging.systemandmessaging.destination.nameexist, the inferred service name is equal to <Value ofmessaging.systemtag>:<Value ofmessaging.destination.nametag>.If
messaging.systemis null, the inferred service name is equal to <Value ofmessaging.destination.nametag>.If
messaging.destination.nameis null, the inferred service name is equal to <Value ofmessaging.systemtag>.
Inferred databases 🔗
When Splunk APM infers a database, it means an instrumented service is making a call to an uninstrumented database.
To identify a database, the kind of the referring span must be equal to client, and the span must contain at least one of the following tags:
db.systemdb.namedb.typedb.instance
To determine the name of an inferred database, Splunk APM applies this logic in the following order:
If the
db.systemtag exists, its value is used to specify the type of database being queried, for examplemysql,redis, and so on. If only this tag is present, its value is also used as theservice.namefor the inferred database.If the
db.nametag exists, its value is concatenated withdb.systemto form the name of the inferred service:db.system:db.name(for examplemysql:sql_db_1).If the
db.connection_stringtag is present and its value conforms to a known format such as Java database connectivity (JDBC), Splunk APM extracts the database name portion of the URL and concatenates it with the value ofdb.systemto form the database name, such asmysql:dbname. If the value ofdb.connection_stringdoes not conform to a known format or the database portion cannot be extracted anddb.namealso does not exist, Splunk APM uses the raw value ofdb.connection_stringas the database name. Ifdb.systemalso exists, the 2 values are concatenated.
Splunk APM also provides additional analytics for supported SQL databases. See Monitor Database Query Performance to learn more.