Scenario: Kai finds the root cause of a user-reported error in Splunk RUM for Mobile 🔗
The following scenario features Buttercup Industries, a fictitious e-commerce company.
About this scenario 🔗
Buttercup Industries recently launched a mobile application. Kai, a site reliability engineer at Buttercup Industries, uses Splunk RUM for Mobile to monitor releases, find root causes of user reported issues, and measure important metrics. In this scenario, Kai leverages Splunk RUM for Mobile to monitor and improve the experience of the Buttercup Mobile app.
Find the root cause of a user-reported error 🔗
Sometimes, users report an issue in the app that requires a lot of digging to find the root cause. For example, if a user says the app isn’t working, it can be tricky to find where to start troubleshooting. With Splunk RUM for Mobile, Kai can search for a the specific user session.
Splunk RUM Mobile captures:
Every screen transition
App lifecycle events (app in foreground, background, app start times)
Network requests
App errors and crashes
Search for a specific session to identify a user reported error 🔗
A user reported that the Buttercup Industries mobile app crashed during the checkout workflow. Kai uses Splunk RUM to trace the user session all the way back to app launch so that they can advise the developers on how to reproduce the issue and fix the root cause.
Kai follows these steps to find a root cause of an error:
Kai opens RUM. From the main navigation panel, they select RUM and then Mobile as the source. The following image shows the application summary dashboard which lists key metrics about the health of their application:
App launches, errors, and crashes
Network requests and errors
App startup time
Detectors

Kai selects See all ButtercupMobile metrics to open the Overview dashboard. The overview page shows a summary of aggregate metrics. From the overview page, Kai can select any link to open Tag Spotlight.
Kai searches for sessions associated with the custom tag “userID” by applying a filter like in the following image.

Kai finds that there is an issue with an error on the ShoppingCart screen and opens an User session to see more sessions related to the crash.
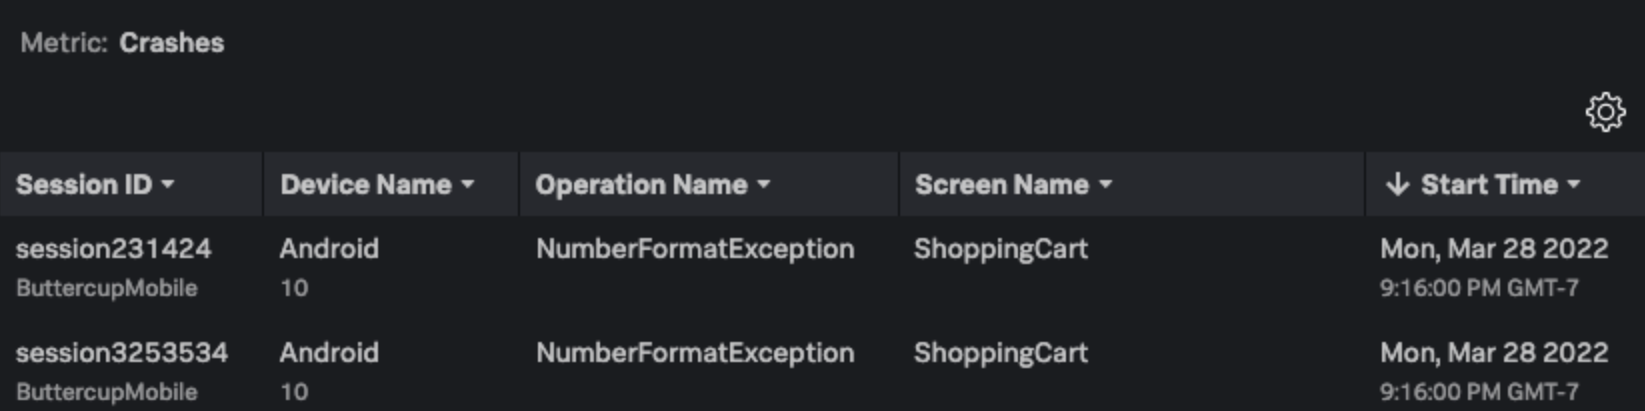
Kai reports the error to the development team and outlines the steps to reproduce the crash and components were affected.
Summary 🔗
In this scenario, Kai searched for a specific session using filters and reviewed a collection of sessions in Tag Spotlight and user sessions. Kai determined that the shopping cart was causing issues in the app and was the reason for a lot of customer complaints. They passed along the crash details to the development team to improve the customer experience.
To learn more about how you can optimize your experience with Splunk Observability Cloud, see the following resources:
Subject |
Resource |
|---|---|
Video tutorials and blog articles |
|
Splunk RUM Documentation |