Scenario: Kai identifies performance bottlenecks with Splunk RUM for Browser 🔗
The following scenario features Buttercup Industries, a fictitious e-commerce company.
About this scenario 🔗
Kai is a site reliability engineer at Buttercup Industries e-commerce company. One of Kai’s main concerns is monitoring the performance of the Buttercup Industries website. When sites are sluggish, users get frustrated and are more likely to abandon a slow site in favor of a faster competitor. In this example, Kai uses Splunk RUM for Browser and Splunk Observability Cloud to identify performance bottlenecks and monitor Web Vitals so that they can troubleshoot customer facing issues on the Buttercup Industries website.
Web vitals 🔗
Google’s Core Web Vitals quantify user experience in terms of page load, visual stability, and interactivity, making them valuable metrics to improve frontend performance. Web Vitals also affect page ranking in Google, which is important for many businesses that rely on search engines for users to discover their sites. Splunk RUM automatically measures Web Vital metrics so Kai can tune into the overview page to check in on the metric scores.
Web Vitals are made up of three metrics that measure user experience:
LCP (largest contentful paint)
CLS (cumulative layout shift)
INP (interaction to next paint).
Monitor Web Vitals 🔗
To monitor the Web Vitals, Kai follows these steps:
Kai opens RUM. From the main navigation panel, they select RUM and Browser as the source.
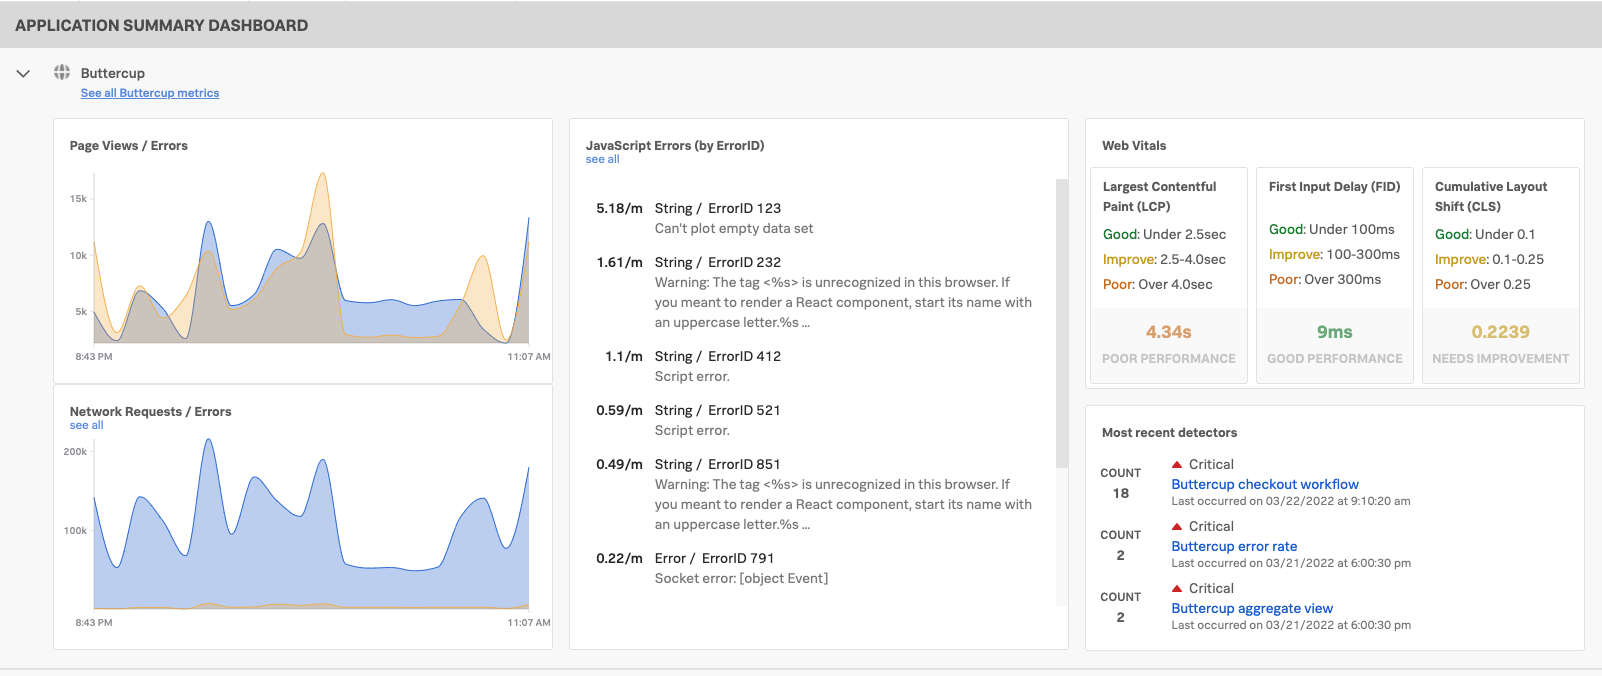
The following image shows the application summary dashboard. Kai sees key metrics about the health of their application like:
Web vitals
Page views/errors
Network requests/errors
JavaScript errors
Detectors
In the Application summary dashboard, Kai sees that LCP has a poor performance score.
Kai clicks on the LCP metric to see more in Tag Spotlight.
Kai can also get to Tag Spotlight by selecting into any metric in the Overview page. In Tag Spotlight Kai can filter session aggregates by endpoint, pages, environments, operation, and more.
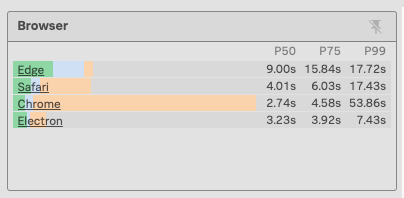
In Tag Spotlight, Kai sees that the P99 loading time for the site is abnormally slow: 53.86 seconds for Chrome users!
This image shows the Browser metric in Tag Spotlight. As the width of the bars in the chart indicate, Chrome has the most users.
Drill down to a user session to troubleshoot slow loading 🔗
In Tag Spotlight, Kai found that something is causing the loading speed of the website to decrease. To dig deeper, Kai opens a User session. By looking in an example session, Kai can investigate the causes of the latency issue.
Kai opens user sessions from Tag Spotlight by selecting the User sessions tab.
The user sessions tab in the Tag Spotlight view shows sessions that contain certain characteristics based on the filters selected.
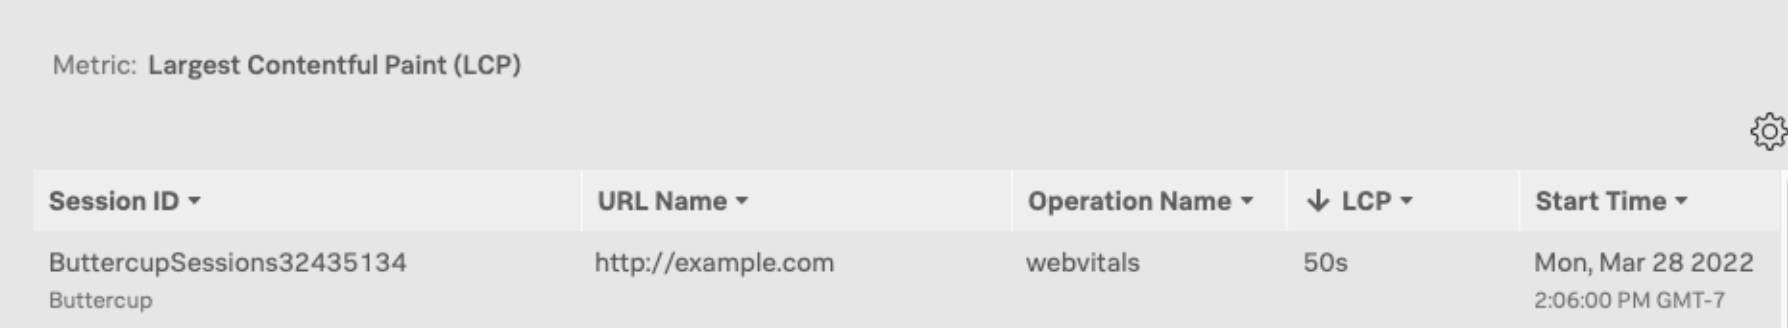
Kai sorts the user sessions by LCP duration to drill into a session with a long load time. Kai opens details about the session by selecting the session ID like the following image.
In the session details view, Kai discovers that the loading latency is from a third-party resource like the following image.
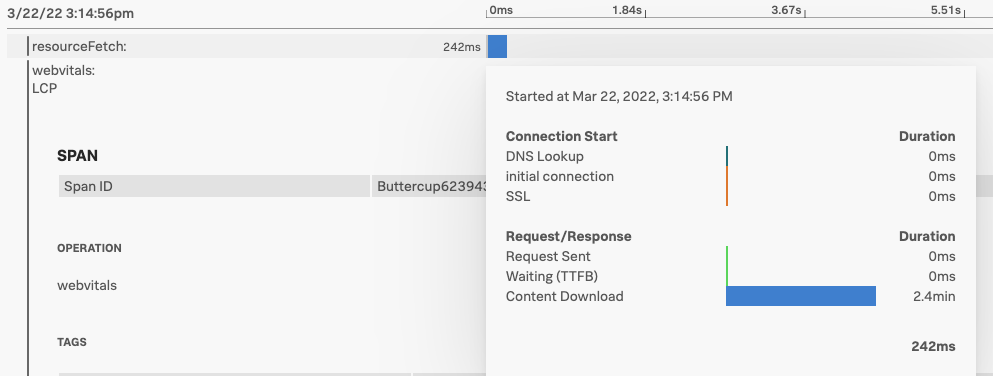
Because Kai knows the latency stemmed from a third-party resource, Kai has the assurance that their own services aren’t causing the issue. Next, they can report the issue and check the status of the third-party resource to see if the service is down.
Summary 🔗
In this scenario, Kai identified problems on the Buttercup Industries website performance by doing the following:
Monitored Web Vitals in the application summary dashboard and identified that LCP was slow.
Investigated the data in Tag Spotlight and discovered there was a loading problem.
Opened a user session to troubleshoot and learned that the resource loading issue was from a third-party vendor.
Reported the issue to the Buttercup Industries developer team so that they can reproduce the issue and work on a fix.
By helping the team improve the Web Vitals score, Kai also helped improve the search engine optimization for their site.
To learn more about how you can optimize your experience with Splunk Observability Cloud, see the following resources:
Subject |
Resource |
|---|---|
Video tutorials and blog articles |
|
Splunk RUM Documentation |