Scenario: Create custom events and monitor a single page application 🔗
The following scenario features Buttercup Industries, a fictitious e-commerce company.
About this scenario 🔗
Buttercup Industries recently started a blog to share customer success stories and engage with their user base. The engineers at Buttercup Industries created the blog as a single-page application (SPA). Kai, a site reliability engineer at Buttercup Industries, monitors the blog with RUM to learn more about route changes, route durations, and back-end calls. Kai also leverages custom events in RUM to monitor how users engage with content on the blog.
Instrument an SPA with Splunk RUM 🔗
Splunk RUM for Browser automatically collects metrics on route changes for an SPA. Route changes are events with zero-second durations.
To monitor an SPA in Splunk RUM, Kai follows these steps:
Kai instruments the blog and names the application
ButtercupBlog. See, Install the Browser RUM agent for Splunk RUM for the steps they take to instrument an SPA with Splunk RUM.Kai opens RUM. From the navigation panel, they select RUM and Browser as the source and ButtercupBlog as the Application.
In the application summary dashboard Kai sees key metrics about the health of their application:
Web vitals
Page views/errors
Route changes
Network requests/errors
JavaScript errors
Detectors
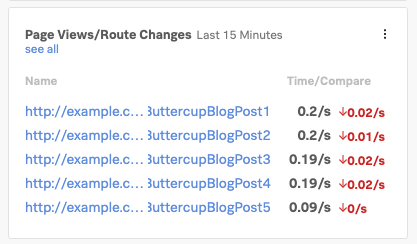
Kai opens Tag Spotlight to look at route changes by selecting see all in the Page views/Route changes metric. The following image shows an example set of URLs for the page view and route change metric in RUM.
To explore individual sessions, Kai opens User sessions.
Create a custom event to measure user engagement on blog posts 🔗
Kai wants to capture metrics for like and share actions on blog posts to help Buttercup Industries gauge how users are interacting with the content. Since there is no route change, and no URL change when someone likes a blog post, Kai creates a custom event to capture this workflow. Custom events are a great tool for Kai to leverage with multiple-page apps single-page apps when they want to monitor a workflow with custom JavaScript logic.
To create a custom event in Splunk RUM that measures likes on a blog post, Kai does the following:
Kai creates a custom event called
blog.likesto track how users engage with content on the Buttercup Blog.
Here is an example of how Kai initializes the tracer and creates a custom event using the NPM package for Splunk RUM for Browser:
import {trace} from '@opentelemetry/api'

const tracer = trace.getTracer('blogLoader');
const span = tracer.startSpan('blog.likes', {
  attributes: {
      'workflow.name': 'blog.likes'
  }
});

// time passes
span.end();
To see the metrics on the custom event they created, Kai navigates to Tag Spotlight where Kai can filter by custom events to see metrics specific to
blog.likes.
Summary 🔗
In this scenario, Kai:
Instrumented an SPA with Splunk RUM by following these steps: Install the Browser RUM agent for Splunk RUM.
Created a custom event to monitor blog posts likes and shares to better understand user engagement by following these steps: Create custom events.
To learn more about how you can optimize your experience with Splunk Observability Cloud, see the following resources:
Subject |
Resource |
|---|---|
Video tutorials and blog articles |
|
Splunk RUM Documentation |