Create a custom configuration of the Content Pack for Splunk Synthetic Monitoring
The out-of-the-box configuration of the services in this content pack includes the most common KPIs for each of the synthetic services. See the KPI Reference for the content pack for more info. If the out-of-the-box configuration of this content pack meets your needs, see Use the Content Pack for Splunk Synthetic Monitoring to get started using the content pack.
If you want to monitor different synthetic KPIs in your configuration of this content pack you can follow these instructions to create a custom configuration of the content pack. You might also want to monitor select synthetic checks, this also requires a custom configuration of the Content Pack for Splunk Synthetic Monitoring.
Step 1: Get your IDs for the synthetic checks
To start, get the IDs for each synthetic check that you want to monitor within your custom configuration of the content pack. To get your check IDs, follow these steps.
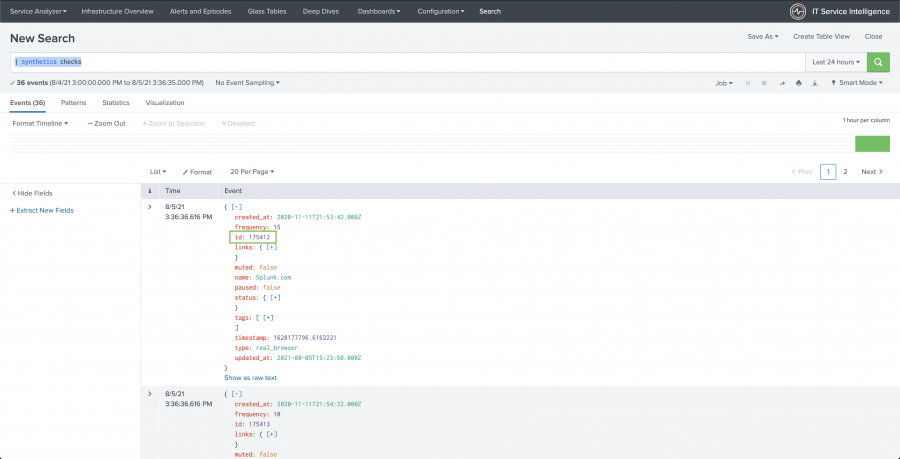
- Go to the Search in the ITSI menu.
- Run the
| synthetics checkssearch command. - Locate the checks you want to monitor in the content pack and save the of the IDs to use in later configuration steps.

Step 2: Clone the service template
Next, create a clone the template service included in the content pack one per check you want to monitor.
- Go to Configuration > Services in the ITSI menu.
- Locate the Splunk Synthetic Monitoring Check Template - (start here) service.
- Select Edit > Clone.
- Enter a service Title, Description, and select a Team.
- Click Clone.
Step 3: Configure the KPIs
Next, you need to configure the KPIs for the service you created. By default, these KPIs are included in the template service you cloned.
- Dom Load Time
- First Interactive Time
- Full Loaded Time
- Lighthouse Score
- Server Errors
- Speed Index
- Total Blocking Time
- Total Content Bytes
- Visually Complete Time
Follow these steps to configure your KPIs:
- Go to Configuration > Services in the ITSI menu.
- Select your cloned service. The cloned service is preconfigured with common KPIs. You can add KPIs that are supported by Splunk Synthetics Monitoring, documented here: Splunk Synthetic Monitoring Performance KPIs. You can also delete the KPIs you don't want to use.
- For each KPI you want to monitor within the content pack follow these steps to add your check ID:
- Select the KPI.
- Expand the Search and Calculate section.
- Select Edit on the Source.
- In the search SPL, update the
idwith check ID for the check you want to monitor.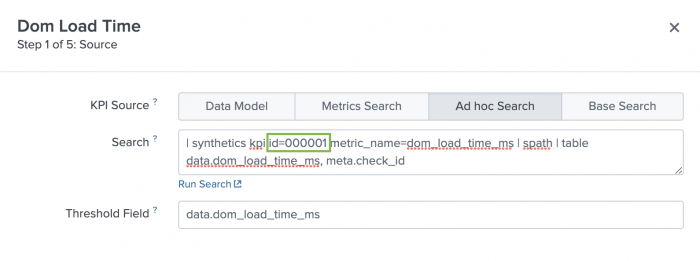
- Select Finish.
- Select Yes to dismiss the warning as this isn't an unsafe change because you are creating a new service.

You can remove any default KPI that you don't want to include in your service. To do so, click the X icon to the right of the KPI and confirm that you want to delete it.
Add KPIs
You can also add KPIs that aren't included in the default list of KPIs. For a full list of KPIs, go to Synthetic Dashboards > Synthetic Monitoring KPI Browser from the Splunk Synthetic Monitoring Add-on menu.
Follow these steps to add a KPI:
- Select Clone to clone an existing synthetic KPI.
- Select a service in the left column to locate a KPI to clone. You can clone any synthetic KPI as we'll be customizing it to use the correct metric in later steps.
- Select the KPI and select Clone.
- Select the newly-cloned KPI.
- Select the pencil icon next to the KPI name to rename the cloned KPI.
- Enter a KPI name and select Done.
- Expand the Search and Calculate section.
- Select Edit on the Source.
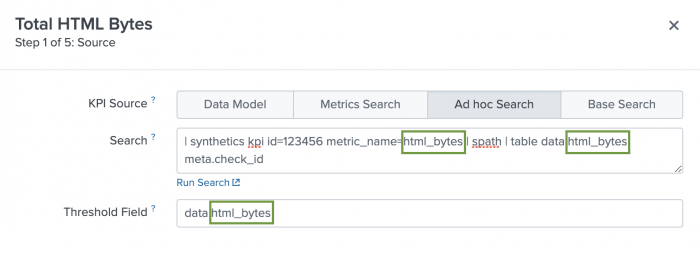
- Replace the existing KPI metric with the KPI metric you want to use in the Search. The metric is present in the search twice.
For example, in this search, the metric name iscontent_bytes:
| synthetics kpi id=000001 metric_name=content_bytes | spath | table data.content_bytes, meta.check_id
If you wanted to usehtml_bytesinstead, the search would like like this:
| synthetics kpi id=000001 metric_name=html_bytes | spath | table data.html_bytes, meta.check_id
- Next, replace the metric in the Threshold Field.
- Select Finish to complete the KPI set up. You can also select Next to make optional customizations to your KPI.

Step 4: Configure the entity rule
Finally, you have to update the entity rules to use the check ID you want to monitor in the content pack. To do so, follow these steps:
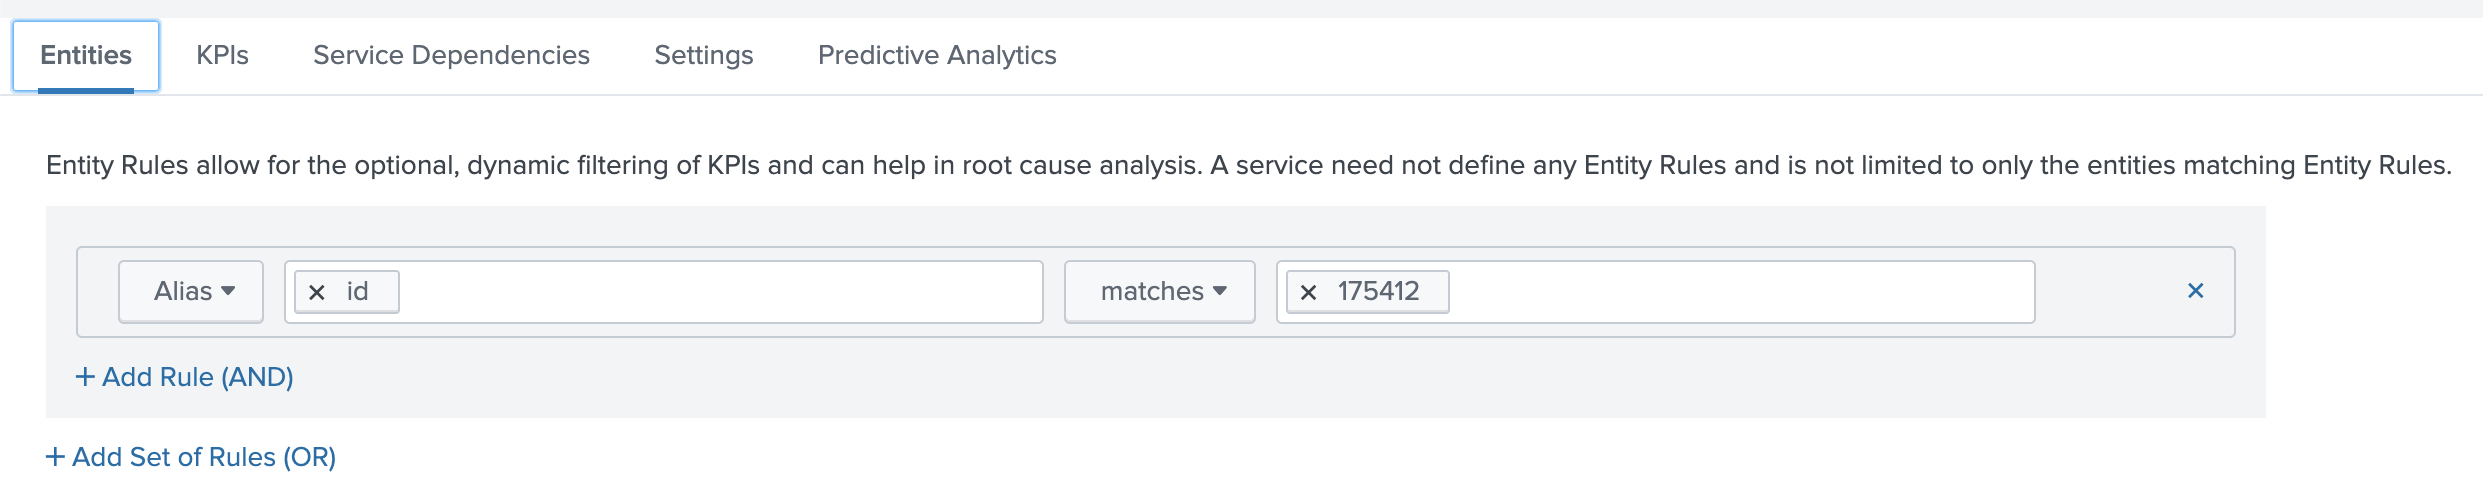
- Within the cloned service select the Entities tab.
- Delete the existing id value.
- Enter the check ID you want to monitor.
- Select Save > Save or Save > Save and Enable if you are ready to enable the service.

Step 5: Configure KPI thresholds
Go through the KPIs and configure the aggregate and per-entity thresholds values to reasonable defaults based on your use case. For steps to configure KPI thresholds, see Configure KPI thresholds in ITSI in the Service Insights manual.
KPI alerting
To receive alerts for KPIs when aggregate KPI threshold values change, see Receive alerts when KPI severity changes in ITSI. ITSI generates notable events on the Episode Review page based on the alerting rules you configure.
Step 6: Configure service dependencies
Once you've created services for all the checks you want to monitor in your custom configuration of the content pack, you might want to create dependencies. This is particularly useful if you make use of the tree view in the service analyzer. See Add service dependencies in ITSI for steps to do so.
Step 7: Customize and save the Service Analyzer
By default, your newly configured services are added to the default analyzer. To create a custom service analyzer that includes only your custom synthetic services service, use the Filter services field to only show custom synthetic checks. When the service analyzer is filtered to the checks you want to monitor select Save as... to create a new service analyzer.

|
PREVIOUS Install and configure the Content Pack for Splunk Synthetic Monitoring |
NEXT Use the Content Pack for Splunk Synthetic Monitoring |
This documentation applies to the following versions of Content Pack for Splunk Synthetic Monitoring: 1.0.0
Feedback submitted, thanks!