Audit dashboards
The Audit domain helps to validate the security of the data within Enterprise Security. Audit and data protection includes resources for ensuring that forwarders are functioning, that data has not been tampered with, that data is secured in transmission, and that the incidents detected by the rules are being reviewed.
Incident Review Audit
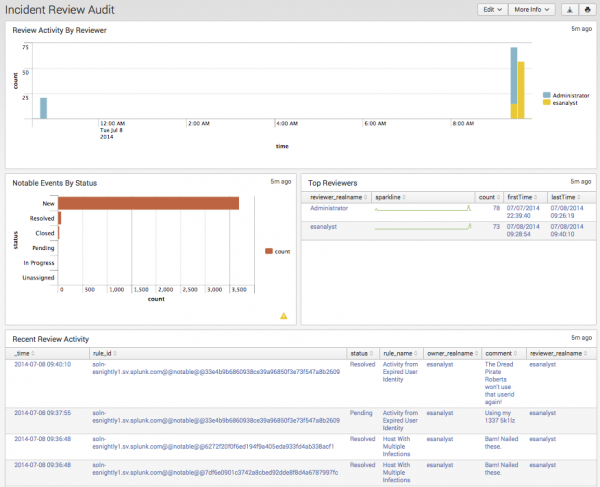
The Incident Review Audit dashboard provides an overview of incident review activity. The panels display how many incidents are being reviewed and by which user, along with a list of the most recently reviewed events. The metrics on this dashboard allow security managers to review the activities of analysts.
Selecting a chart element or table row on a panel will drill-down to an event. See dashboard drilldown in this manual.
| Panel | Description |
|---|---|
| Review Activity by Reviewer | Displays the numbers of events reviewed by each user. This panel is useful for determining which user is performing the incident reviews and if the total number of incidents reviewed is changing over time. |
| Notable Events by Status | Displays the total notable events by all statuses. This panel is useful for determining if the incident review users are keeping up with incidents, or whether a backlog of unreviewed incidents is forming. |
| Top Reviewers | Displays the top users that have performed incident reviews. The panel includes details for each user, including the date they first performed an incident review, the date they last performed a review, and the number of incidents reviewed. |
| Recent Review Activity | Shows the most recent incident review changes performed. |
Suppression Audit
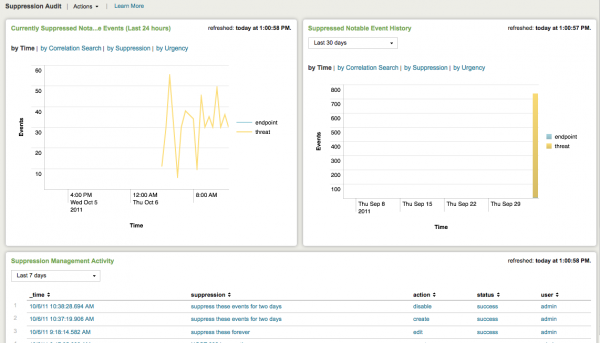
The Suppression Audit dashboard provides an overview of notable event suppression activity. This dashboard shows how many events are being suppressed and by whom so that notable event suppression can be audited and reported on.
The metrics on this dashboard allow security managers to review the activities of analysts, which is useful for tuning correlation searches. This also provides visibility into the different dimensions of suppression activity within the Incident Review workflow.
Clicking chart elements or table rows displays a listing of the notable events that have been suppressed based on the selected element.
Currently Suppressed Notable Events (Last 24 hours)
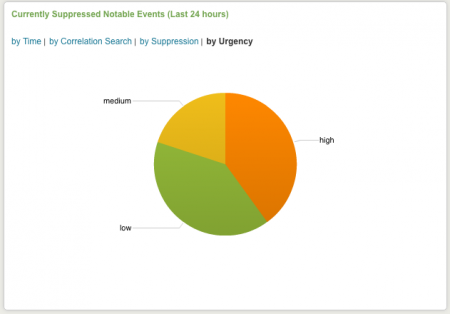
Currently suppressed notable events are shown in this panel. These can be displayed by time, by correlation search, by suppression rule, or by urgency.
The following table describes the options for display.
| Display option | Description |
|---|---|
| by Time | Suppressed Notable Events by time of event |
| by Correlation Search | Suppressed Notable Events by correlation search |
| by Suppression | Suppressed Notable Events by suppression rule |
| by Urgency | Suppressed Notable Events by urgency |
Suppressed Notable Event History
This panel displays the history of suppressed notable events. The time range for results can be selected from the drop-down menu. The following table describes the options for display of the results.
| Display option | Description |
|---|---|
| Time range | Select from drop-down menu |
| by Time | Suppressed Notable Event History by time |
| by Correlation Search | Suppressed Notable Event History by correlation search |
| by Suppression | Suppressed Notable Event History by suppression rule |
| by Urgency | Suppressed Notable Event History by urgency |
Suppression Management Activity
This panel shows suppression management activity for the selected time period.
The following table describes the fields in this panel.
| Field | Description |
|---|---|
| Time range | Select from drop-down menu |
| _time | Time that the suppression took place |
| suppression | Name of the rule being suppressed |
| action | Options: create, disable, enable |
| status | Options: success, failure |
| user | Options: unassigned, admin, esadmin, esanalyst |
For more information about an event, click on the item.
Expired Suppressions
When a suppression rule is created, an expiration date is defined. This panel shows the history of expired suppressions that occurred during selected time period. The fields displayed in this panel are described in the following table.
| Field | Description |
|---|---|
| Time range | Select from drop-down menu |
| _time | Time that the rule expired |
| suppression | Name of the expired rule |
| action | Options: create, disable, enable |
| status | Options: success, failure |
| user | Options: unassigned, admin, esadmin, esanalyst |
For more information about an expired suppression, click on the item.
Data Model Audit
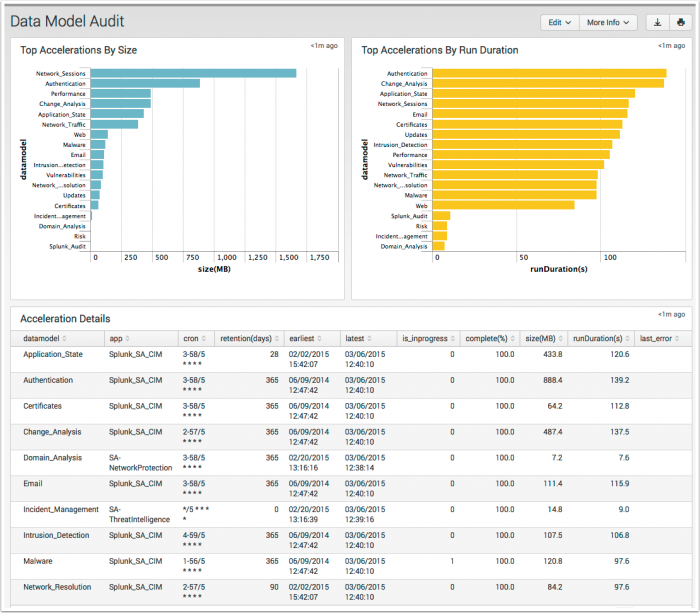
The Data Model Audit dashboard displays information about the data models available in your environment.
This dashboard is available by default under the Audit domain menu.
The following table describes the panels for this dashboard.
| Panel | Description |
|---|---|
| Top Accelerations By Size | A descending view of the accelerated data models by MB on disk |
| Top Accelerations By Run Duration | A descending view of the accelerated data models by time to run acceleration |
| Accelerations Details | A table view of the accelerated data models that provides additional information |
Forwarder Audit
The Forwarder Audit dashboard helps ensure that hosts are properly forwarding data to Splunk. Forwarder Auditing detects forwarders that have failed and helps diagnose the cause of the failure, such as excessive resource utilization or forwarders not configured to start up when the host starts. This dashboard does not audit all forwarding activity, only that of systems that are configured as expected hosts in Enterprise Security. To see all forwarding activity, the Deployment Monitor app may be a good choice.
What is an expected host?
Expected hosts are denoted by a value of "is_expected=true" in the Asset table. The main search controls contain a filtering option to include/exclude these hosts.
Click on chart elements or table rows on this page to display a listing of event review activity. See dashboard drilldown for more information.
The following table describes the panels for this dashboard.
| Panel | Description |
|---|---|
| Dashboard filters | Restricts the view on the current dashboard to assets that match the selected criteria. Selections apply to the current dashboard only. The following domain-specific options are available for this dashboard:
|
| Hosts Not Reporting | Shows hosts that ought to be sending events to Splunk but are not; this may mean that the forwarder is down and needs troubleshooting. |
| Splunk Resource Utilization | Shows the resource utilization of each instance of the Splunk daemon (splunkd) that is sending events to Splunk. This is useful for detecting forwarders that are overtaxing their hosts. These forwarders are likely to forward events improperly and, and may drop events or submit them with a delay.
|
| Splunk Anomalous StartMode | Shows hosts that that are forwarding events to Splunk using splunkd but that are not configured to have splunkd to start on boot. These forwarders will not function when the host is rebooted unless splunkd is manually started each time and are likely to experience an outage when the host is rebooted.
|
Per-Panel Filter Audit
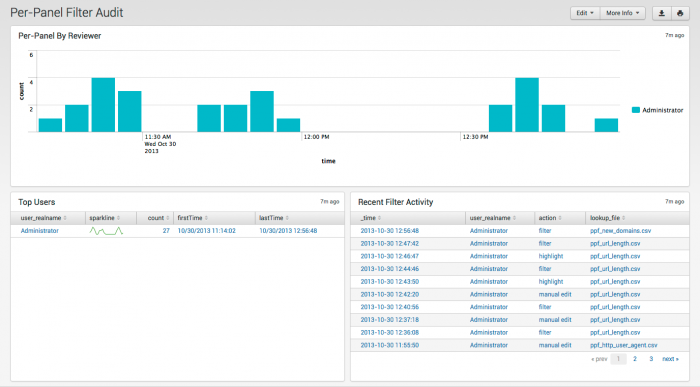
The Per-Panel Filter Audit dashboard provides information about the filters currently in use in your deployment.
The following table describes the panels for this dashboard.
| Panel | Description |
|---|---|
| Per-Panel By Reviewer | Count of updates to per-panel filters by user |
| Top Users | Shows users, sparkline for trends, number of views, and first and last time viewed. |
| Recent Filter Activity | Activity by time, user, action, and filename |
Search Audit
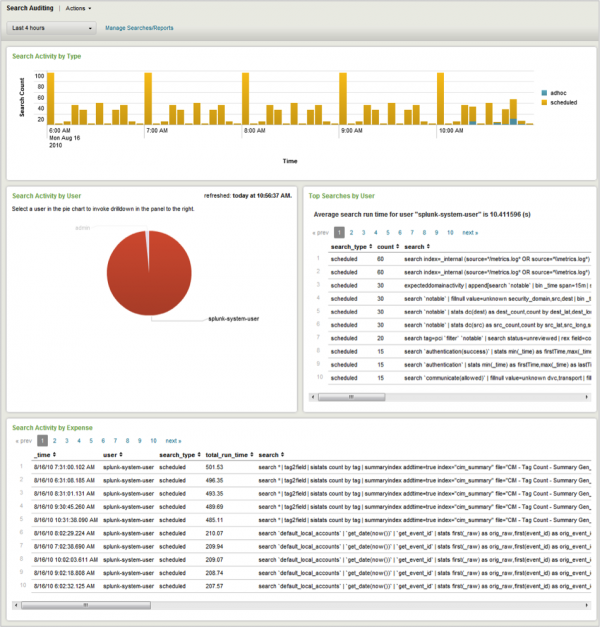
The Search Audit dashboard provides information about the searches being executed in Splunk. This dashboard is useful for identifying longer-running searches and tracking search activity over time and by user. Internal searches used by Enterprise Security are set to "user=unknown".
Clicking chart elements or table rows on this page displays the raw events that are generating the items represented. See dashboard drilldown for more information.
The following table describes the panels for this dashboard.
| Panel | Description |
|---|---|
| Dashboard filters | Restricts the view on the current dashboard to assets that match the selected criteria. Selections apply to the current dashboard only. See descriptions of the standard filter options. |
| Search Activity by Type | Shows the number of searches executed over time by type (ad-hoc, scheduled, or real-time). Helps determine whether Splunk's performance is being affected by excessive number of searches. |
| Search Activity by User | Shows the number of searches executed by each user. Helps determine when a particular user is executing an excessive number of searches. Note: |
| Top Searches by User | Lists the searches most commonly executed by the user selected in the Search Activity by User panel (see above). If no user is selected in the Search Activity by User panel, this panel is empty. |
| Search Activity by Expense | Lists the most expensive searches in terms of duration. Helps to identify specific searches that may be adversely affecting Splunk performance. |
View Audit
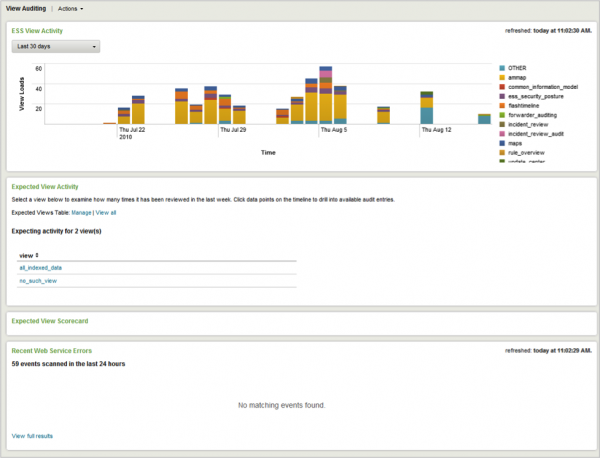
The View Audit dashboard provides information about the frequency at which the Enterprise Security views are being accessed. View Audit enables tracking whether or not selected views are being reviewed on a daily basis and helps to identify any errors triggered when users access the views. Availability of views can be managed through Enterprise Security Configuration.
Clicking chart elements or table rows on this dashboard displays a listing of event review activity. See dashboard drilldown for more information.
The following table describes the panels for this dashboard.
Threat List Audit
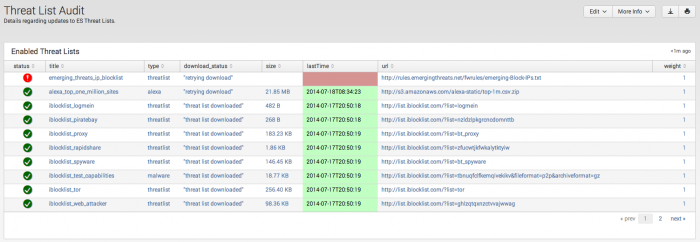
The Threat List Audit dashboard tracks and displays the current status of all threat lists. As an analyst, you can review this dashboard to determine if the threat lists are being kept current, and troubleshoot connection issues.
| Panel | Description |
|---|---|
| Enabled Threat Lists | Displays the status of all enabled threat lists |
| Local Threat Lists | Displays the status of locally created and customized threat lists. |
| Disabled Threat Lists | Displays all disabled threat lists. |
| Threat list Download Events | Displays the python_modular_input_log events applicable to threat list downloads.
|
A correlation search is available to create a notable event if a threat lists download fails. Browse to Configure > General > Custom Searches to review the Failed Threat List Download search.
| Additional Network dashboards | Create new correlation searches |
This documentation applies to the following versions of Splunk® Enterprise Security: 3.2, 3.2.1, 3.2.2



 Download manual
Feedback submitted, thanks!