User Activity Monitoring
User Activity
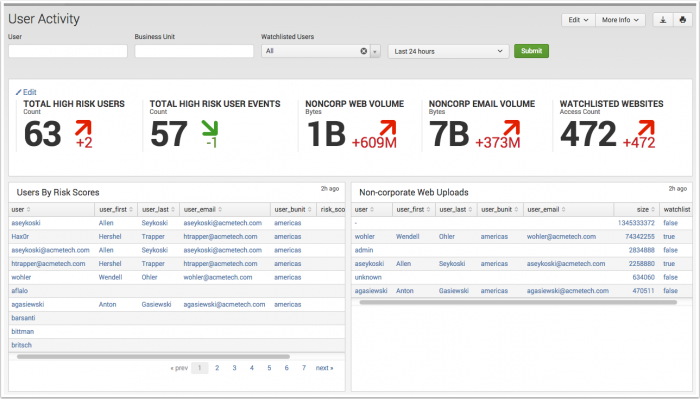
The User Activity dashboard displays panels representing common user activities that generate risk. For more information about risk scoring, see "Risk scoring" in this manual.
Dashboard filters
Use the available dashboard filters to refine the results displayed on the dashboard panels. The filters do not apply to key security indicators.
| Filter by | Description | Action |
|---|---|---|
| User | A known or unknown identity | Text field. Empty by default. Wildcard strings with an asterisk (*) |
| Business Unit | A group or department classification for the identity. | Text field. Empty by default. Wildcard strings with an asterisk (*) |
| Watchlisted Users | Designates a monitored identity. | Drop-down: select to filter by |
| Time Range | Select the time range to represent. | Drop-down: select to filter by |
Dashboard Panels
| Panel | Description |
|---|---|
| Key Indicators | Displays the metrics relevant to the dashboard sources over the past 24 hours. Key indicators represent summary information and appear at the top of the dashboard. See "Key indicators" in this manual. |
| Users By Risk Scores | Displays the top 100 highest risk users. As an insider threat can represent subtle and indirect changes in behavior, this panels assists an analyst in focusing on the riskiest users in the organization. The drilldown redirects the page to the "Identity Investigator" dashboard and searches on the selected user. |
| Non-corporate Web Uploads | Displays high volume upload and download activity by user. An irregular pattern of upload or download activity can be an indicator of data exfiltration. The drilldown redirects the page to the "Identity Investigator" dashboard and searches on the selected user. |
| Non-corporate Email Activity | Displays the top 100 users performing high volume email activity to non-corporate domains. A pattern of large or high volume email activity can be an indicator of data exfiltration. The drilldown redirects the page to the "Identity Investigator" dashboard and searches on the selected user. |
| Watchlisted Site Activity | Displays web access by user. Accessing specific categories of web sites while using workplace resources and assets can be an indicator of insider threat activity. The drilldown redirects the page to the "Identity Investigator" dashboard and searches on the selected user. |
| Remote Access | Displays remote access authentication by user. A user performing risky web or email activity while using remote access services can be an indicator of data exfiltration, or exploited credentials. The drilldown redirects the page to the "Identity Investigator" dashboard and searches on the selected user. |
| Ticket Activity | Displays ticketing activity by user. A user performing risky web or email activity while filing tickets to provide additional services or internal access can be an indicator of data exfiltration, or exploited credentials. The drilldown redirects the page to the "Identity Investigator" dashboard and searches on the selected user. |
Data sources
The reports in the User Activity dashboard reference data fields in multiple sources. Relevant data sources include proxy servers, gateways and firewalls, or other sources that reference a distinct user. In addition, new lookup content and fields in the Identities must be provided for the panels on the User Activity dashboard to populate. For a list of additional sources, see the "Troubleshooting" topic.
Access Anomalies
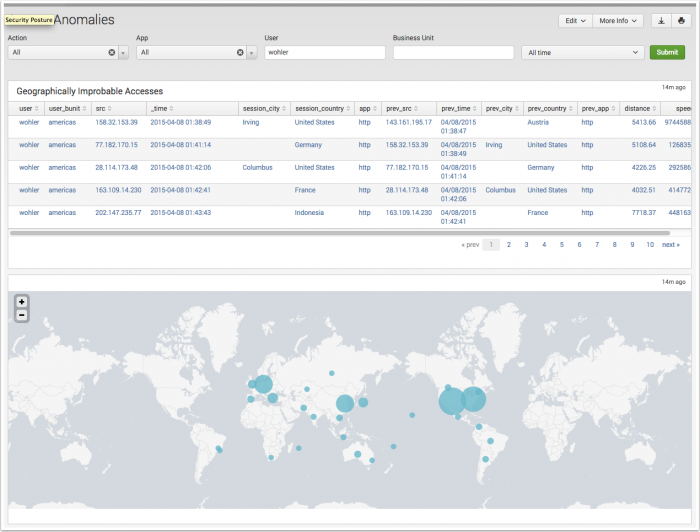
The Access Anomalies dashboard displays concurrent accesses and improbable travel anomalies by leveraging internal user credentials and location relevant data.
Dashboard filters
Use the available dashboard filters to refine the results displayed on the dashboard panels.
| Filter by | Description | Action |
|---|---|---|
| Action | A successful or failed authentication attempt | Drop-down: select to filter by |
| App | The application field in the authentication data model | Drop-down: select to filter by |
| User | A known or unknown identity | Text field. Empty by default. Wildcard strings with an asterisk (*) |
| Business Unit | A group or department classification for the identity. | Text field. Empty by default. Wildcard strings with an asterisk (*) |
| Time Range | Select the time range to represent. | Drop-down: select to filter by |
Dashboard Panels
| Panel | Description |
|---|---|
| Geographically Improbable Accesses | Displays users that initiated multiple authentication attempts separated by an improbable time and distance. Authenticating from two geographically distant locations in a time frame lower than typical transportation methods provide can be an indicator of exploited credentials. The drilldown redirects the page to the "Access Search" dashboard and searches on the selected user. |
| Concurrent Application Accesses | Displays users that initiated multiple authentication attempts from unique IP addresses within a short time span. This pattern of authentication can be an indicator of shared or stolen credentials. The drilldown redirects the page to the "Access Search" dashboard and searches on the selected user. |
Data sources
The reports in the Access Anomalies dashboard reference data fields in the Authentication data model. Relevant data sources include proxy servers, gateways and firewalls, or other sources that reference a distinct user.
Troubleshooting
1. This dashboard references data from various data models. Without the applicable data, the dashboards will remain empty.
2. Use the Open in Search link available in the lower left corner of a dashboard view to perform a direct search against the data model. The New Search dashboard also exposes the search commands and objects used to populate the view.
3. Determine if any data required for a dashboard is available in the data model.
- a. Determine the data model objects used by a dashboard:
Dashboard Name Panel Title Data Model Data Model Object User Activity Users By Risk Scores Risk Analysis All_Risk.risk_object Non-corporate Web Uploads Web Web.bytes, .user, .http_method, .url Non-corporate Email Activity All_Email.size, .recipient, .src_user, Watchlisted Site Activity Web Web.src, .url Remote Access Authentication Authentication.src, .user Ticket Activity Ticket Management All_Ticket_Management.description, .priority, . severity, .src_user Access Anomalies Geographically Improbable Accesses Authentication Authentication.app, .src, .user_bunit Concurrent Application Accesses Authentication.app, .src, .user
- b. Use the data model and data model object to search for events in the data model:
Action Search Expected Result Verify the data is normalized to the Common Information Model | datamodel data_model_name root_object_name search | table _time, sourcetype, root_object_name.* Example: | datamodel Network_Traffic All_Traffic search | dedup sourcetype | table _time, sourcetype, All_Traffic.*
Returns a list of sourcetypes and the data model objects and fields populated by that sourcetype.
4. Validate the data model is being accelerated.
- In the Splunk App for Enterprise Security, browse to Audit > Data Model Audit. Review the Acceleration Details panel for information about the data model acceleration status.
- Note: For more information about data model acceleration and the Enterprise Security App, see "Data models in the Enterprise Security app" in the Installation and Configuration Manual.
5. Validate additional required data sources are available.
Dashboard Name Data type Data source User Activity Lookups The Cloud Domains, Corporate Email Domains, and Corporate Web Domains lookup files. Identities The Identity fields: bunit,watchlist,work_city,work_country,work_lat, andwork_long. For more details, see the topic on "Identity correlation" in this manual.Correlation Searches * High Volume Email Activity with Non-corporate Domains
* Watchlisted Event Observed
* Web Uploads to Non-corporate Sites by Users
Access Anomalies Correlation Searches * Impossible Travel Events Detected For Users
| Risk Analysis | Threat Intelligence |
This documentation applies to the following versions of Splunk® Enterprise Security: 3.3.0, 3.3.1, 3.3.2, 3.3.3


 Download manual
Feedback submitted, thanks!