Monitor threat activity in your environment with a glass table
In this example, monitor threat activity in your environment by creating a glass table that visualizes and tracks specific threat activity metrics.
- Create a glass table to monitor threat activity.
- Start monitoring threat activity metrics on the glass table.
- Organize the metrics visually.
- Monitor custom metrics on the glass table.
- Save and view the glass table.
Create a glass table to monitor threat activity
- From the Splunk ES menu bar, click Glass Tables to open the list of existing glass tables.
- Click Create New Glass Table.
- Type a Title of Monitor Threat Activity.
- Type a Description of Monitor threat activity in the network. Displays metrics related to threat notables, threat actors, and types of intelligence.
- Click Shared in App to allow other users of Splunk Enterprise Security to view the glass table.
- Click Create Glass Table.
- Click the title of the glass table to edit it.
Start monitoring threat activity metrics on the glass table
After opening the glass table to edit, collect the relevant threat activity metrics for your glass table.
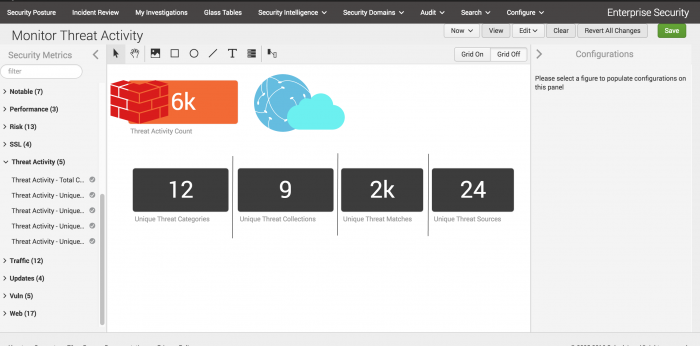
- In the list of Security Metrics, click Threat Activity
- Click the Threat Activity - Total Count metric and drag it onto the glass table.
- In the Configurations panel, scroll down to Thresholds and select On.
- Click Edit to set up a threshold.
- Click Add Threshold and type 50 for a Medium number of total threat activity events.
- Repeat to add a High threshold of 100 events.
- Make sure that the threshold below medium is set to Normal.
- Click Done to save the changes to the threshold.
- Click Update to save the changes to the security metric.
- Click and drag the Threat Activity - Unique Categories metric, the Threat Activity - Unique Collections metric, the Threat Activity - Unique Matches metric, and the Threat Activity - Unique Sources metric onto the canvas. Do not set a threshold for the categories, sources, or collections metrics, because a higher number of categories, sources, and collections indicates only that there is more intelligence available to you, rather than a security incident that needs attention.
Organize the metrics visually
Use the editing tools on the glass table canvas to upload images, draw shapes, add icons, add text, and make connections that reflect the relationships between the threat metrics.
- Click each metric and modify the width and height of each metric to make it the shape you want.
- Draw lines between the different threat activity metrics to differentiate the types of metrics.
- If threat activity tracking happens at the router or firewall level, add a router or firewall icon.
Monitor custom metrics on the glass table
Add a custom search to track custom threat activity metrics. You want to track threat activity by a specific threat group, the APT group.
- In a new tab, open the Search dashboard and construct a search that looks for the APT group. This search relies on the threat list activity correlation search, and identifies notable events over time that contain threat activity from the APT threat group.
`notable("Threat - Threat List Activity - Rule")` | search threat_category="APT" | stats count by threat_category - When you are satisfied with your search, copy it to your clipboard.
- Return to the glass table to add an ad hoc search.
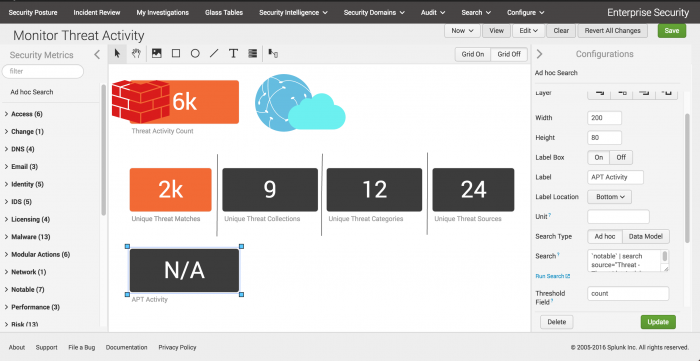
- In the list of Security Metrics, click Ad hoc search and drag it onto the glass table.
- In the Configurations editor, type a Label of APT activity for your ad hoc search.
- Copy your previously-created search that identifies APT activity by threat category in your environment.
`notable("Threat - Threat List Activity - Rule")` | search threat_category="APT" | stats count by threat_category - Click Update to save your changes to the ad hoc search metric.
Save and view the glass table
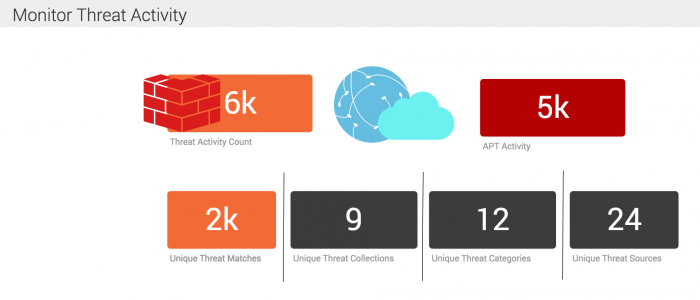
After you finish creating the glass table, you can start monitoring threat activity.
- Click Save.
- Click View.
| Monitor privileged accounts for suspicious activity |
This documentation applies to the following versions of Splunk® Enterprise Security: 4.5.0, 4.5.1, 4.5.2, 4.5.3, 4.6.0 Cloud only, 4.7.0, 4.7.1, 4.7.2, 4.7.3, 4.7.4, 4.7.5, 4.7.6, 5.0.0, 5.0.1, 5.1.0, 5.1.1, 5.2.0, 5.2.1, 5.2.2, 5.3.0, 5.3.1, 6.0.0, 6.0.1, 6.0.2, 6.1.0, 6.1.1, 6.2.0, 6.3.0 Cloud only, 6.4.0, 6.4.1, 6.5.0 Cloud only, 6.5.1 Cloud only


 Download manual
Feedback submitted, thanks!