Investigate notables using drilldown searches and dashboards in Splunk Enterprise Security
Use drill-down searches in Splunk Enterprise Security to quickly pivot to a search related to a notable event. For more information on drill down searches, see Drill down on event details in the Search manual.
Additionally, you can drill-down to multiple dashboards if you want to view more than one drill-down search for a notable during your investigation. You can configure drill-down dashboards for a notable using the notable adaptive response action in the Correlation Search Editor. Drill-down dashboards provide additional context to the notables. You can access all the configured drill-down dashboards for a notable from the Incident Review page or from the Risk Timeline visualization.
An error message might be displayed if you do not have the required permissions to access the dashboards or the dashboard no longer exists. You can also edit or delete the drilldown dashboards to reduce visual clutter if they are no longer needed.
Configure multiple drill down searches for a notable
Configure multiple searches as drill-downs to investigate different scenarios during investigations or notable analysis. You can access these drill-down searches easily from the notable.
If you use the Correlation Search Editor in Splunk Enterprise Security version 7.2.0 or higher to edit correlation searches that include legacy parameters specific to your environment, these legacy parameters that might be referenced in the correlation search via macros will be deleted unless you upgraded those parameters using custom scripts.
Do not use configuration files to edit your drill-down searches manually when configuring multiple drill-down searches. If you are on on-prem user, you must use the UI to create drill-down searches. Otherwise, you might see some parsing errors. In such cases, fix the issues in the configuration files prior to using multiple drill-down searches for investigations.
If you configure multiple drill-down searches for a notable, the risk timeline uses only the first drill-down search for the visualization.
- In the Content Management page of Splunk Enterprise Security, select the correlation search to which you want to add a drill down search.
- Select Edit Selected to open the Correlation Search Editor.
- In the Correlation Search Editor, go to Adaptive Response Actions.
- Select Add new adaptive response action, then select Notable. Alternatively, you can edit the adaptive response action if it was added previously.
- Go to Drill-down search.
The following screenshot displays an example of populating the UI fields to add a drill-down search to a notable:
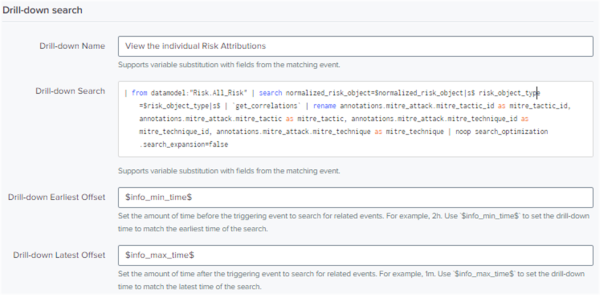
- Enter the Drill-down Name.
- Enter the Drill-down Search.
The fields
Drill-down NameandDrill-down searchare required to configure a drill-down search. - In the
Drill-down earliest offsetfield, type the amount of time before the time of the triggering event to look for related events for the Contributing Events link in the notable event. For example, 2h to look for contributing events 2 hours before the triggering event. - In the
Drill-down latest offsetfield, type the amount of time after the time of the triggering event to look for related events for the Contributing Events link in the notable event. For example, 1h to look for contributing events 1 hour after the triggering event. - Select +Drill-down search to add another drill-down search to the notable.

View drill-down searches associated with a notable
Follow these steps to view the drill-down searches associated with a notable:
- In Splunk Enterprise Security, select Content > Content Management to open the risk incident rule in the Correlation Search Editor.
- Go to Adaptive Response Actions > Notable.
- If a drill-down search exists for the notable, use the Drill-down Search to identify the following:
- All relevant risk events applied to the risk object including
risk message,src,dest,user, andrisk factors - MITRE ATT&CK annotations
- Related risk objects associated with the risk events
- All relevant risk events applied to the risk object including
Alternatively, you can also use the following procedure to view the drill-down searches associated with a notable:
- In Splunk Enterprise Security, go to Incident Review.
- Expand the risk notable for which you want to view the drill down searches.
- Go to Drill-down search and select the drill down search.
View drill down searches in the Risk Event Timeline
You can view the drill down searches associated with a risk notable in the Risk Event Timeline visualization for a risk notable. When expanding risk incident rules in the Risk Event Timeline view, click on a drilldown field named Contributing events: View contributing events.
When you select the Risk Event count on the Incident Review page, drill-down searches for each individual event are displayed. However, only the first drill-down search for the notable is used to load the events listed in the Risk Event Timeline.
If you configured multiple drill-down searches for a notable, the risk timeline uses only the first drill-down search for the visualization.
For more information on the Risk Event Timeline visualization, see Analyze risk events using the Risk Timeline in Splunk Enterprise Security.
Configure drill-down dashboards for a notable
To configure or edit drill-down dashboards, you must have the capability to view the specific dashboard and edit correlation searches. To view the drill-down dashboard from the Incident Review page, you must have viewing permissions for the specific dashboard. For more information on configuring user roles and capabilities, see Configure users and roles in the Splunk Enterprise Security Installation and Upgrade Manual.
Follow these steps to configure a drill-down dashboard for a notable:
- In the Splunk Enterprise Security app, go to the Correlation Search Editor.
- In the Adaptive Response Action section, expand Notable.
- Scroll to Drill-down dashboards and select + Add drill-down dashboard.
- Select a dashboard from the drop-down menu. This is a Required field. For example: DA-ESS AccessProtection/access_anomalies
- Type a name for the drill-down dashboard. This is a Required field. For example: View the individual risk attributes.
- (optional) Select Edit Tokens to open the Edit Tokens dialog and edit the dashboard.
- Enter the Token Name.
Refer to the URL of the dashboard when you configure the drill down dashboard to find the token name. - Enter Token Value as
$<token value>$.
You can add multiple tokens by selecting +Drill-down Token in the Edit Tokens dialog. - Select Save to save the configured dashboards.
You can configure multiple drill-down dashboards for a notable by selecting '''+ Add drill-down dashboard''' as required.
View drill-down dashboards for a notable
Prerequisite Ensure that you have access to the dashboard, otherwise you might get a 404 error.
To configure or edit drill-down dashboards, you must have the capability to view the specific dashboard and edit correlation searches. To view the drill-down dashboard from the Incident Review page, you must have viewing permissions for the specific dashboard. For more information on configuring user roles and capabilities, see Configure users and roles in the Splunk Enterprise Security Installation and Upgrade Manual.
Follow these steps to view configured drill-down dashboards for a notable on the Incident Review page:
- In the Splunk Enterprise Security app, go to the Incident Review page.
- In the Incident Review page, expand the notable and scroll to the Drill-down Dashboards section.
- Select the dashboard link to view the drill-down dashboard.
Follow these steps to view configured drill-down dashboards on the Risk Timeline visualization:
- Access the Risk Timeline visualization on the Splunk Enterprise Security app.
- Under Contributing Risk Events, expand the notable and scroll to Drill-down Dashboards.
- Select the dashboard link to view the drill-down dashboard.
For more information on how the Risk Timeline visualization works, see How the Risk Timeline visualization works in Splunk Enterprise Security and Review risk notables to identify risk in Splunk Enterprise Security in the Use Splunk Enterprise Security Risk-based Alerting manual.
Delete drill-down dashboards associated with a notable event
Follow these steps to delete a configured drill-down dashboard for a notable to reduce visual clutter if the dashboard is no longer needed.:
- In the Splunk Enterprise Security app, go to the Correlation Search Editor.
- In the Adaptive Response Action section, expand Notable.
- Scroll to the dashboard you want to delete in the Drill-down dashboards section.
- Select X next to the dashboard to delete the dashboard.
See also
To learn more about drill-down searches and drill-down dashboards, see the product documentation:
- Use drilldown for dashboard interactivity in the Dashboard and Visualizations manual
- Drill down on event details in the Search manual
- Use drilldown for dashboard interactivity in the Splunk Enterprise Dashboards and Visualizations manual
|
PREVIOUS Manage investigations in Splunk Enterprise Security |
NEXT Administer and customize the investigation workbench |
This documentation applies to the following versions of Splunk® Enterprise Security: 7.3.0, 7.3.1
Feedback submitted, thanks!