Troubleshoot Splunk Cloud Gateway Connection Issues
If you're experiencing network connection issues, make sure that your Splunk Cloud Gateway version is up to date and configure your network settings appropriately.
To test for https connection or WebSocket connection, you must have the admin role. To perform troubleshooting tasks in the Splunk web and Splunk Cloud Gateway UI, you must have either the admin or sc_admin role.
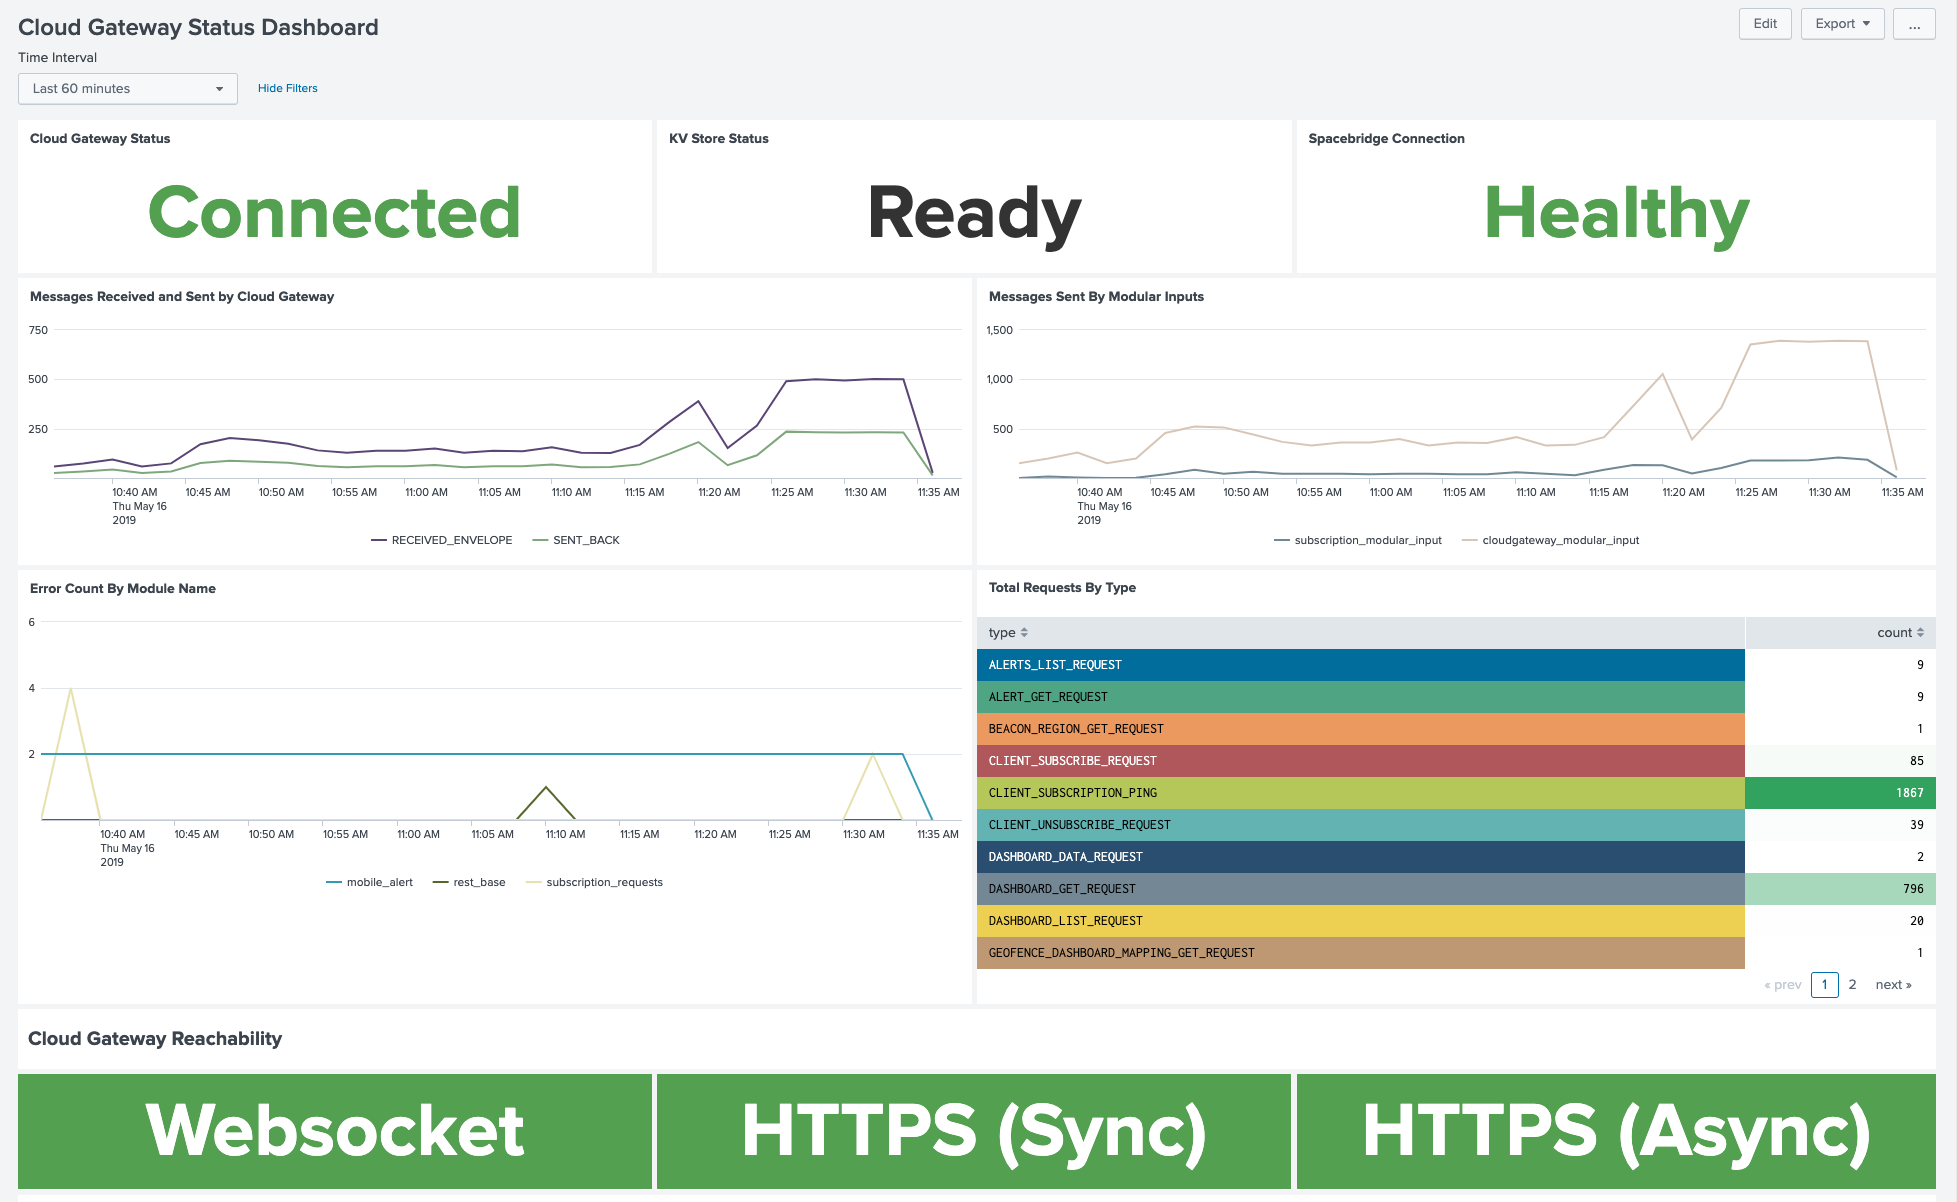
Check the Cloud Gateway Status dashboard
The Splunk Cloud Gateway app comes with a Cloud Gateway Status dashboard that displays connection status, KV Store status, message requests, and more. View the Cloud Gateway Status dashboard in a Connected Experiences app or in Splunk Web.
Or, you can manually check for connection by doing the following tests.
Test for https connection
Verify the search head host has access to the Spaceridge. For example:
$ curl https://prod.spacebridge.spl.mobi/health_check
This response verifies that the search head host has access to the Spacebridge. For example:
Spacebridge Status: OK
If you're using a Windows system that does not include the curl command, paste https://prod.spacebridge.spl.mobi/health_check in a web browser.
If you don't receive a Spacebridge Status: OK response when checking if the search head host has access to Spacebridge, or if the modular_inputs aren't running, there might be an installation issue. See Troubleshoot Splunk Cloud Gateway to check if the modular_inputs are running, and see Install Splunk Cloud Gateway for installation information.
If Splunk Cloud Gateway isn't loading, clear your browser's cache, or use an incognito tab. Splunk Cloud Gateway may not load due to cache conflicts.
Test for WebSocket connection
Splunk Cloud Gateway uses the WebSocket protocol to maintain communication between Spacebridge and your Splunk Enterprise instance. Open port 443 outbound to prod.spacebridge.spl.mobi to allow the WebSocket connection.
To check if you have WebSocket connection, run the following curl command at the command line:
curl -i -N -H "Connection: Upgrade" -H "Upgrade: websocket" -H "Host: echo.websocket.org" -H "Origin: https://www.websocket.org" https://echo.websocket.org
To test WebSocket connectivity between your host and Splunk Cloud Gateway, run the following curl command on command line:
curl -i -N -H "Connection: Upgrade" -H "Upgrade: websocket" -H "Host: prod.spacebridge.spl.mobi" -H "Origin: https://prod.spacebridge.spl.mobi" -H "Authorization: c014fb4e" https://prod.spacebridge.spl.mobi/mobile
Proxies and firewalls may interrupt this connection. Adjust your proxy or firewall by doing the following:
- Make sure you're using a compatible proxy server. See Install Splunk Cloud Gateway for more information about using a proxy server with Splunk Cloud Gateway.
- If your proxy is running SSL decryption, it must support WebSockets or exempt
prod.spacebridge.spl.mobi.
Make sure you've configured your proxy correctly
Make sure you're using a compatible proxy. See Install Splunk Cloud Gateway for more information about compatible proxies.
If you're using a supported proxy, ensure that your proxy is acting as a true passthrough proxy and isn't stripping any headers.
Search the Splunk Cloud Gateway logs for errors
Use Search & Reporting to search the Splunk Cloud Gateway logs for errors.
Search for unusual errors
Search for unusual errors in Search & Reporting:
index=_internal source=*cloud* ERROR AND NOT SUBSCRIPTION
Trace a specific request
Search for a specific request ID to trace a specific request:
index=_internal source=*cloud* request_id
Then, copy and paste the request ID in the search:
index=_internal source=*cloud* request_id=<your_id_here>
Export logs
Export the logs to further troubleshoot Splunk Cloud Gateway. Export Splunk Cloud Gateway logs as raw events so that you can utilize sourcetype="cloudgateway_app_internal_log".
| Select which Splunk apps to show dashboards from in the mobile apps | Troubleshoot Splunk Cloud Gateway |
This documentation applies to the following versions of Splunk® Cloud Gateway (Legacy): 1.1.0, 1.2.0, 1.2.2, 1.2.3, 1.3.0, 1.3.1, 1.4.0, 1.5.0, 1.6.0, 1.7.0, 1.7.2, 1.8.0, 1.9.0, 1.9.1, 1.11.0, 1.12.0, 1.12.1, 1.12.2, 1.12.4, 1.13.0, 1.13.2, 1.13.3

 Download manual
Feedback submitted, thanks!