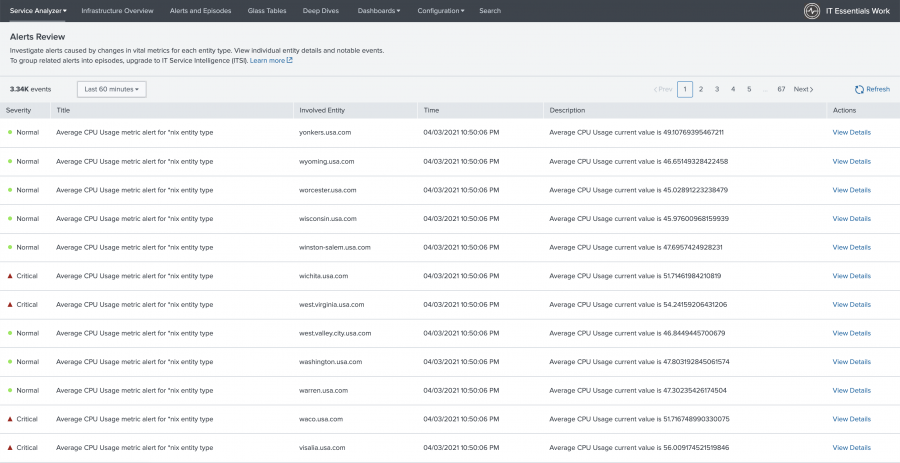
Overview of Alerts Review in IT Essentials Work
The Alerts Review dashboard in IT Essentials Work enables you to investigate alerts caused by changes in the vital metrics for entity types in your environment. Leverage this view to monitor the health of your overall system and quickly understand the availability and performance of your server infrastructure. Use the dashboard to view the alert severity and impacted entities. To group related alerts into episodes, upgrade to IT Service Intelligence (ITSI).
The Alerts Review page includes the following sections:
| Column Name | Description |
|---|---|
| Severity | The threshold severity level configured for the vital metric alert.
|
| Title | The title for the vital metric alert. |
| Involved Entity | The specific entity associated with the alert. |
| Time | The time that an alert was created. |
| Description | Details about the vital metric alert. |
You can drill down to the individual entity details by clicking View Details.
Vital metrics for entity types
Vital metrics are statistical calculations based on SPL searches that represent the overall health of entities of that type. Vital metrics can search against both metrics and logs data, while the search result must be a metric. Entity types define how to classify a type of data source. To learn more about entity types, see Overview of entity types in ITSI.
In the following example, the entity type's vital metrics are average CPU usage, memory usage, disk availability, and network usage:
Perform the following steps to access the vital metrics for an entity type:
- From the ITE Work main menu, click Infrastructure Overview.
- In the Group by dropdown, choose Entity Type.
- Select the card for the entity type you want to analyze.
The vital metrics for all entity types are defined in itsi_entity_type.conf. One vital metric contains "is_key": 1 which designates it as the key statistic displayed in the Infrastructure Overview histogram.
The vital metrics search of each of the default entity types uses a macro like itsi_entity_type_nix_metrics_indexes to find data. If the entity type histogram or vital metrics shows no data, it's possible that the data resides in another index. If this is the case, modify the macro to include your index.
Configure vital metric alerts
You can configure alerts that generate notable events when vital metrics cross your established thresholds. Perform the following steps to configure vital metric alerts for default entity types:
- From the ITE Work main menu, click Configuration > Entities.
- Click Entity Types.
- Click Edit on the entity type you want to edit.
- Expand the Vital Metrics (optional) section and select the vital metric that you want to create an alert for. The alert will be applied to all entities categorized under the entity type that you create the alert for.
- In the Alerting section, click Add Alert. The alert is enabled by default.
- In the alert window, set the alert schedule, a time to suppress the alert after it is fired, and alert thresholds for the vital metric.
- Set up trigger conditions for the thresholds. The Critical threshold is required. You can adjust this threshold value, but the threshold cannot be deleted.
- (Optional) Click Add a threshold level to create a Warning threshold.
- For the If metric is field, select greater than or less than to set the threshold hierarchy. If you select greater than, the Critical threshold is a maximum threshold. If you select less than, the Critical threshold is a minimum threshold.
- Click Save.
- After configuring a vital metric alert, a new saved search is created in savedsearches.conf. When you remove an alert, the saved search will be deleted.
This documentation applies to the following versions of Splunk® IT Essentials Work: 4.9.0, 4.9.1, 4.9.2, 4.9.3, 4.9.4, 4.9.5, 4.9.6, 4.10.0 Cloud only, 4.10.1 Cloud only, 4.10.2 Cloud only, 4.10.3 Cloud only, 4.10.4 Cloud only, 4.11.0, 4.11.1, 4.11.2, 4.11.3, 4.11.4, 4.11.6, 4.12.0 Cloud only, 4.12.2 Cloud only, 4.13.0, 4.13.1, 4.13.2, 4.13.3, 4.14.0 Cloud only, 4.14.1 Cloud only, 4.14.2 Cloud only, 4.15.0, 4.15.1, 4.15.2, 4.15.3, 4.16.0 Cloud only, 4.17.0, 4.17.1


 Download manual
Feedback submitted, thanks!