Apply anomaly detection to a KPI in ITSI
IT Service Intelligence (ITSI) anomaly detection uses machine learning algorithms to model KPI behavior and generate alerts when a KPI deviates from an expected pattern. If the KPI diverges from the normal pattern, ITSI creates a notable event in Episode Review.
ITSI provides two anomaly detection algorithms that learn KPI patterns continuously in real time, and detect when a KPI departs from its own historical behavior. Enable anomaly detection to identify trends and outliers in KPI search results that might indicate an issue with your system.
Prerequisite
Anomaly detection requires Java 8 - 11 to be installed on all search heads running ITSI. For more information, see Install required Java components in the Install and Upgrade IT Service Intelligence manual.
When to enable anomaly detection
Consider the following guidelines when deciding whether to apply anomaly detection to a KPI:
- Because anomaly detection looks for deviations from a historic pattern, it's best to enable it for KPIs that have established baselines of data points and show a pattern or trend over time.
- Make sure your historic data isn't too random. If the historic data is noisy, a pattern will be difficult to detect, and anomalies will be difficult to find.
- Remember that random spikes are not necessarily anomalies. You can configure regular thresholds to alert on these. Anomaly detection is more useful if the KPI doesn't necessarily spike, but instead begins to behave abnormally.
Anomaly detection use case
Online sales typically follow a sine wave each day, with low load in the early morning and peak load in the early evening.

If instead the sales flatline at around medium load, the change would not set off a status-based alert since the KPI isn't actually spiking. However, anomaly detection notices the change in behavior and generates a notable event.
Anomaly detection algorithms
ITSI provides two anomaly detection algorithms: trending and entity cohesion.
Trending algorithm
The trending algorithm detects anomalous patterns in a single time series (or metric). A sliding window on the time series is monitored by a scoring function. The scoring function compares patterns in the current window with patterns in historical data, and continuously generates scores to reflect the anomalousness of the current window.
ITSI computes thresholds adaptively without any distribution assumptions. Thresholds are robust to outliers. Anomalously high scores generate notable events.
- Applied to KPI aggregate event results.
- Detects anomalous patterns in the KPI time series.
- Adaptive thresholds applied using machine learning.
- Recent data is compared to historical trends.
- Anomalously high scores generate an alert as a notable event.

Trending anomaly detection applies to aggregate KPI events, and is useful for tracking anomalous KPI behavior on the service level.
Entity cohesion algorithm
Entity cohesion analysis detects anomalous patterns in multiple time series simultaneously. The group of entities the algorithm monitors is assumed to have similar, or "cohesive", behavior and patterns.
A scoring function continuously monitors all time series within a sliding window and generates scores for each time series to reflect its departures in pattern from the rest of the series. Significant departures of a time series from its cohesive peers are indicated by high anomaly scores, which trigger alerts using similar thresholding techniques as the trending algorithm.
- Examines multiple time series (one per entity) simultaneously.
- The KPI must be split by entity, and a minimum of four entities is required.
- If the time series values for a given entity departs significantly from the typical pattern, ITSI generates a notable event.

Entity cohesion anomaly detection applies to KPIs that are shared across multiple entities, and is useful for tracking anomalous behavior on the entity level.
Enable anomaly detection for a KPI
Before you enable anomaly detection on a KPI, it is a best practice to use the Analyze KPI Data tool to confirm that anomaly detection is recommended for that KPI. This tool tells you if the algorithms will produce meaningful results for the KPI based on specific criteria. KPIs that do not meet the criteria for the algorithm are likely to generate false positives and are not recommended.
You can enable anomaly detection algorithms for any KPI irrespective of the analysis results. The only scenario in which you cannot enable the algorithm is in the case of entity cohesion, if the KPI is not split by entity.
Prerequisites
- You must have the
write_itsi_servicecapability to enable anomaly detection. Theitoa_team_adminanditoa_adminroles have this capability by default. - You need at least 24 hours of data in the summary index to apply anomaly detection to a KPI.
- To enable entity cohesion analysis, the service to which the KPI belongs must contain at least 4 entities.
Steps
- Click Configuration > Services.
- Open the service containing the KPI for which you want to apply anomaly detection.
- Select the KPI.
- Expand the Search and Calculate panel.
- In the Unit row, click Edit.
- Select Enable backfill and define the backfill period over which you want to analyze KPI data.
- Click Finish.
- Expand the Anomaly Detection panel.
- In Analysis Time Window, select the time range for KPI data analysis.
- Click Analyze KPI Data.
- If Algorithm Analysis Result shows Recommended, then the KPI meets the criteria for the algorithm.
- If Algorithm Analysis Result shows a warning message, then the KPI does not meet the criteria for use with the algorithm. Mouse over the tooltip to learn more about the algorithm requirements. See Algorithm analysis criteria below.
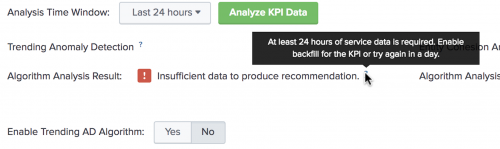
- If Algorithm Analysis Result shows Recommended, then the KPI meets the criteria for the algorithm.
- For each recommended algorithm, click Yes to enable it.
- Adjust the Algorithm Sensitivity slider to set the algorithm's sensitivity to variance in data. The more sensitive the algorithm is, the more likely it is to generate an anomalous event. The algorithm now evaluates the KPI data continuously and generates anomalous events based on the algorithm sensitivity threshold.
- Click Save.

Algorithm analysis criteria
The following table outlines the specific criteria a KPI must meet to be recommended for use with the respective algorithm.
| KPI Criteria | Trending algorithm | Entity Cohesion algorithm |
|---|---|---|
| Minimum amount of data | 24 hours | 24 hours |
| % of anomalous data points | < 10% | < 10% |
| Minimum number of entities | N/A | 4 entities minimim |
| Maximum number of entities | N/A | 30 entities per KPI |
Triage and investigate anomalous events
An anomalous event is an event that is inconsistent with or deviating from what is usual. ITSI generates a notable event in Episode Review when it detects an anomalous event.
It can take up to 24 hours for anomaly detection to begin generating events. You can then open an event in a deep dive to perform root cause analysis.
- The trending algorithm generates notable events with the heading "Service level alert on KPI."
- The entity cohesion (cohesive) algorithm generates notable events with the heading "Entity level alert on KPI."
The type of algorithm that generated the notable event appears in the Details section of the Overview tab.
Investigate anomalous events in a deep dive
You can drill down to a deep dive from any anomalous notable event. This lets you view the event over a default 10 minute time range, and perform root cause analysis in the context of other service KPIs.
- Select the anomalous notable event in Episode Review.
- Under Drilldowns, click the Drilldown to <service_name> link. A deep dive opens with an overlay of the anomaly in the KPI lane. Anomalous events appear as red icons. The following image shows an example of anomaly overlays:
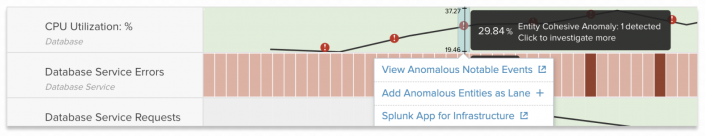
- (Optional) Mouse over the alert icon to select options to view notable events or add anomalous entities as new lanes. Add additional KPIs to the deep dive for contextual analysis of the anomalous event.

For more information, see Add entity and anomaly overlays to a deep dive in ITSI.
Set the maximum entity limit
The Entity Cohesion algorithm supports a maximum of 30 entities per KPI. Although this limit is configurable, it is recommended that you do not exceed 30 entities. If you run KPI analysis against a KPI that has more than the 30 entities, a warning message appears stating that the KPI has too many entities, and the KPI is not recommended.
You can lower the maximum number of entities at which KPI analysis triggers a warning message.
Prerequisites
- Only users with file system access, such as system administrators, can set the maximum entity limit for cohesion analysis.
- Review the steps in How to edit a configuration file in the Admin Manual.
Never change or copy the configuration files in the default directory. The files in the default directory must remain intact and in their original location.
Steps
- Open or create a local mad.conf file for the ITSI app at $SPLUNK_HOME/etc/apps/SA-ITSI-MetricAD/local/.
- Under the
[cohesive]stanza, setmetrics_maximumto a lower value. For example:[cohesive] metrics_maximum = 15
Increase anomaly detection memory requirements
By default, anomaly detection reserves 1GB of memory, which is enough for up to 1000 KPIs for trending analysis or up to 1000 metrics for cohesive analysis. To support more than this, increase the Heap memory size in SA-ITSI-MetricAD/local/command.conf on your search heads. To determine the amount of memory you should use, size your analysis requirement first, then calculate your memory requirements based on that.
Trending anomaly detection requires about 600MB per 1000 KPIs. Entity cohesion anomaly detection requires about 1GB per 1000 metrics (for example, a combination of 50 KPIs with 20 entities or 40 KPIs with 25 entities). The entity cohesion algorithm supports a maximum of 30 entities per KPI, and it is recommended that you don't exceed 30 entities.
These recommendations are guidelines. Many factory can influence memory usage for anomaly detection, such as the size of historical data, algorithm configurations, and available CPU.
Prerequisites
- Only users with file system access, such as system administrators, can change anomaly detection memory requirements.
- Review the steps in How to edit a configuration file in the Admin Manual.
Never change or copy the configuration files in the default directory. The files in the default directory must remain intact and in their original location.
Steps
Perform the following steps on each search head.
- Open or create a
commands.conffile at$SPLUNK_HOME/etc/apps/SA-ITSI-MetricAD/local/. - Under the
[MAD]stanza, change the "1G" part of thecommand.arg.1=-J-Xmx1Gsetting to increase the memory. - Restart Splunk software.
| Create multi-KPI alerts in ITSI | Aggregate versus maximum severity KPI values in ITSI |
This documentation applies to the following versions of Splunk® IT Service Intelligence: 4.11.0, 4.11.1, 4.11.2, 4.11.3, 4.11.4, 4.11.5, 4.11.6, 4.12.0 Cloud only, 4.12.1 Cloud only, 4.12.2 Cloud only, 4.13.0, 4.13.1, 4.13.2, 4.13.3, 4.14.0 Cloud only, 4.14.1 Cloud only, 4.14.2 Cloud only, 4.15.0, 4.15.1, 4.15.2, 4.15.3, 4.16.0 Cloud only, 4.17.0, 4.17.1, 4.18.0, 4.18.1, 4.19.0, 4.19.1, 4.19.2, 4.19.3, 4.19.4, 4.20.0
Feedback submitted, thanks!