Create custom entity types in ITSI
You can create custom entity types in (ITSI) to associate particular analysis data filters and navigations with custom entities. For more information about default entity types and analysis data filters, see Overview of entity types in ITSI.
Optionally, create analysis data filters, attach dashboards, and add navigations for each entity type. Analysis data filters, dashboards, and navigations are components of entity types and can't exist independent of entity types.
Preconfigured entity types and their components are defined in $SPLUNK_HOME/etc/apps/SA-ITOA/default/itsi_entity_type.conf. For more information, see itsi_entity_type.conf in the Administration Manual. Entity type information is stored in the itsi_entity_type KV store collection.
Here's an example entity type for a VMware cluster entity with events and metrics analysis data filters and a single default overview dashboard. Analysis data filters are called data_drilldowns and entity overview dashboards are called dashboard_drilldowns. Each analysis data filter has example static filters and entity filters.
Example VMware Cluster entity type
[vmware_cluster]
title = VMware Cluster
description = VMware Cluster type
data_drilldowns = [ \
    { \
        "title": "VMware Cluster metrics", \
        "type": "metrics", \
        "static_filter": { \
            "type": "include", \
            "field": "metric_name", \
            "values": ["vsphere.cluster.*"] \
        }, \
        "entity_field_filter": { \
            "type": "and", \
            "filters": [ \
                { \
                    "type": "entity", \
                    "data_field": "moid", \
                    "entity_field": "moid" \
                }, \
                { \
                    "type": "entity", \
                    "data_field": "vcenter", \
                    "entity_field": "vcenter" \
                } \
            ] \
        } \
    }, \
    { \
        "title": "VMware Inventory logs", \
        "type": "events", \
        "static_filter": { \
            "type": "include", \
            "field": "index", \
            "values": ["vmware-inv"] \
        }, \
        "entity_field_filter": { \
            "type": "entity", \
            "data_field": "moid", \
            "entity_field": "moid" \
        } \
    }, \
    { \
        "title": "VMware Cluster Events logs", \
        "type": "events", \
        "static_filter": { \
            "type": "and", \
            "filters": [ \
                { \
                    "type": "include", \
                    "field": "index", \
                    "values": [ \
                        "vmware-taskevent" \
                    ] \
                }, \
                { \
                    "type": "include", \
                    "field": "sourcetype", \
                    "values": [ \
                        "vmware_inframon:events" \
                    ] \
                }, \
                { \
                    "type": "include", \
                    "field": "computeResource.computeResource.type", \
                    "values": [ \
                        "ClusterComputeResource" \
                    ] \
                } \
            ] \
        }, \
        "entity_field_filter":{ \
            "type": "entity", \
            "data_field": "computeResource.computeResource.moid", \
            "entity_field": "moid" \
        } \
    } \
]
dashboard_drilldowns = [ \
    { \
        "title": "VMware Cluster Overview Dashboard", \
        "id": "vmware_cluster_overview_dashboard", \
        "base_url": "", \
        "is_splunk_dashboard": false, \
        "params": { \
            "static_params": {}, \
            "alias_param_map": [] \
        } \
    } \
]
vital_metrics = [ \
    { \
        "metric_name": "Average CPU Usage", \
        "search": "| mstats avg(vsphere.cluster.cpu.usage) as val WHERE `itsi_entity_type_vmware_cluster_metrics_indexes` by moid,vcenter span=5m", \
        "split_by_fields": ["moid", "vcenter"], \
        "matching_entity_fields": ["moid", "vcenter"], \
        "is_key": 1, \
        "unit": "%" \
    }, \
    { \
        "metric_name": "Average Effective Memory", \
        "search": "| mstats avg(vsphere.cluster.clusterServices.effectivemem) as val WHERE `itsi_entity_type_vmware_cluster_metrics_indexes` by moid,vcenter span=5m", \
        "split_by_fields": ["moid", "vcenter"], \
        "matching_entity_fields": ["moid", "vcenter"], \
        "is_key": 0, \
        "unit": "MB" \
    }, \
    { \
        "metric_name": "Hosts Up", \
        "search": "search index=vmware-inv sourcetype=vmware_inframon:inv:hostsystem | spath moid output=moid | spath changeSet.summary.runtime.powerState output=powerState | search powerState=poweredOn | bin span=1h _time | stats distinct_count(moid) as val by cluster.moid host _time | rename \"cluster.moid\" as moid", \
        "split_by_fields": ["moid", "host"], \
        "matching_entity_fields": ["moid", "vcenter"], \
        "is_key": 0, \
        "unit": "" \
    }, \
    { \
        "metric_name": "Triggered Alarms", \
        "search": "search index=vmware-taskevent sourcetype=vmware_inframon:events | spath entity.entity.moid output=moid | spath entity.entity.type output=etype | search moid=* etype=ClusterComputeResource | search eventClass=AlarmActionTriggeredEvent | eval isAlarmTriggered=if(eventClass=\"AlarmActionTriggeredEvent\",1,0) | bin span=1h _time | stats sum(isAlarmTriggered) by host, moid _time", \
        "split_by_fields": ["moid", "host"], \
        "matching_entity_fields": ["moid", "vcenter"], \
        "is_key": 0, \
        "unit": "" \
    } \
]
Create an entity type
Create entity types to group entities of the same kind together. You can use this grouping to visualize and troubleshoot entities of that specific type. For example, you can group entities by entity type in the Infrastructure Overview to visualize key metrics relating to the health of that entity type. View and manage entity types from the entity type lister page.
Use the entity type name to associate entities with it. When you import entities from a Splunk search or CSV, include a column entry that exactly matches the name of an existing entity type, otherwise the import process ignores the entity type field. For more information, see Associate entities with an entity type in ITSI.
Associate navigations and analysis data filters with an entity type to power entity visualizations. These components populate dashboards for entities you associate with an entity type. For more information about how these components help you visualize entity data, see Overview of entity types in ITSI.
Prerequisite
You have to log in as a user with the itoa_admin or itoa_team_admin role.
Step 1: Create an entity type
When you create an entity type, you can also add navigations and analysis data filters for it. If you don't add navigations or analysis data filters now, you can add them later.
- From the ITSI main menu, go to Configuration > Entity Management.
- Select the Entity types tab.
- Click Create Entity Type.
- Specify entity type information. Enter an Entity type name to reference the entity type.
- Optionally, provide a description of the entity type for yourself or other users.
Step 2: Add vital metrics to your entity type
Vital metrics are statistical calculations based on SPL searches that represent the overall health of entities of that type. Vital metrics can search against both metrics and logs data, while the search result must include a metric field whose values are timestamped. Examples of vital metrics include average CPU usage, memory usage, disk availability, and network usage.
You can select an entity type within the Infrastructure Overview to further drill down to its entity health page, which displays the vital metrics for that entity type and the health of all entities of that type. You must designate one metric as the key metric, meaning it's the main statistic displayed in the Infrastructure Overview histogram. For more information about the Infrastructure Overview, see About the Infrastructure Overview in ITSI.
Perform the following steps to configure vital metrics for an entity type:
- Click Add Metric and provide a name for your vital metric.
- Provide the SPL search that calculates the value of the metric. The search must contain the following fields:
Field Description valSpecifies the value of the metric. For example, avg(LogicalDisk.%_Free_Space) as val._timeThe UI attempts to render changes over time. You can achieve this rendering by adding span={time}to your search. For example,bin span=1h _time. - (Optional) Click Add a matching field to add entity matching fields, which are the fields used to look up entities from the KV store. Add a field to split from your search results and select an entity alias field to match it with. For example, you could include the following matches:
InstanceId = instance_idregion = zone
InstanceIdandregionare used to split the metrics by entities associated with the entity type, which enables ITSI to calculate the distribution of values to display in the histogram.instance_idandzoneare the aliases used to match with the fields specified by the split fields. - Choose a key metric, which is the main statistic displayed in the Infrastructure Overview histogram.
- When you're finished adding all your vital metrics, click Save in the modal.
Navigations are external URLs that pass entity parameters belonging to the entity type to the URL. For example, if you enter http://buttercup.com as the URL and make the entity parameter host=hostname, the resulting link will be http://www.butter.com?hostname=splunk.com, if the entity has a host value equal to "splunk.com".
If you enter a single word as the URL, like user_dashboard, ITSI assumes you entered a custom dashboard in Splunk. The resulting link would be <user_splunk_host>:<port>/en-US/app/itsi/user_dasboard.
Configure the following fields:
| Field | Description |
|---|---|
| Navigation name | A name to reference the navigation later. You see this name as a link on the side panel of the entity health page. It should be a unique name. |
| URL | The resource you want to associate with entities that belong to the entity type. It can be a Splunk Web URL or a completely external URL. You can also substitute entity fields directly in the URL. For example, |
| Entity parameters | Optionally, specify parameters to pass information about entities in the URL when you go to the navigation. Select entity informational fields or alias fields from the dropdown menu. The field has to already exist in ITSI. If you want to add entity fields for the navigation that don't already exist in ITSI, you can save the configuration and come back later to add them once entities contain those fields. |
Click Save navigation when you're done.
Step 4: Add Splunk dashboards to your entity type
You can attach one or more Splunk XML dashboards to your entity type. The dashboards appear on the entity detail page of every entity associated with the entity type. The dropdown only lists the dashboards you have permission to view. You can also attach your custom dashboards to entity types.
Optional prerequisite for custom dashboards: Configure tokens in your dashboards
There are two optional configurations available if you are linking to a custom dashboard. First, you can configure entity parameters to filter the data in the dashboard. Configuring an entity field allows you to pass a parameter to a dashboard component to filter the dashboard data. There is also an option to add a time-range picker. Configuring a time-range picker allows you to sync to the time picker on the entity detail page to the dashboard; so, selections made within ITSI are synced to any time-range pickers in the dashboard. Follow these prerequisite steps if you are linking to a custom dashboard and want to use these optional configurations:
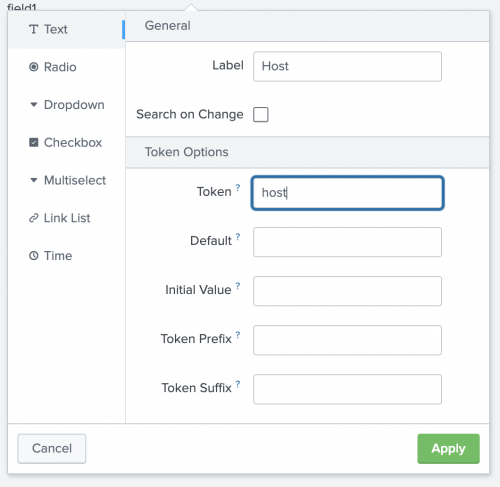
Configure entity-field tokens in your dashboards
To configure a dashboard input to accept data from an entity-field filter follow these steps:
- Go to the dashboard that you linked to in the entity type.
- Edit the dashboard.
- Create a new input or edit an existing input where you want to pass the data.
- Enter a unique token string.
- Click Apply.
- Save the dashboard changes.

Next, you're ready to link to the dashboard and configure the entity parameters. Go to Configuration > Entities > Entity types. Edit the entity type and go to the Splunk dashboards section and follow the steps to link to a dashboard.
Configure time-range-picker tokens in your dashboards
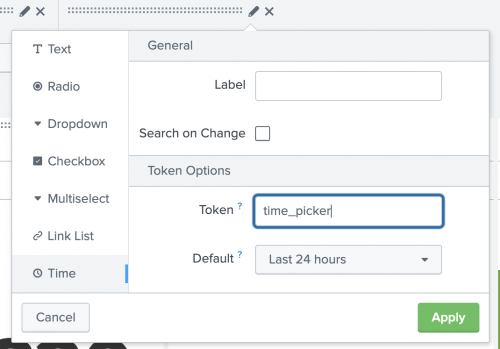
To configure your time inputs to sync to the universal time picker, follow these steps:
- Go to the dashboard that you linked to in the entity type.
- Edit the dashboard.
- Add a new time input or edit an existing time input that you want to pick with the time picker on the entity detail page.
- Enter a unique token string.
- Click Apply.
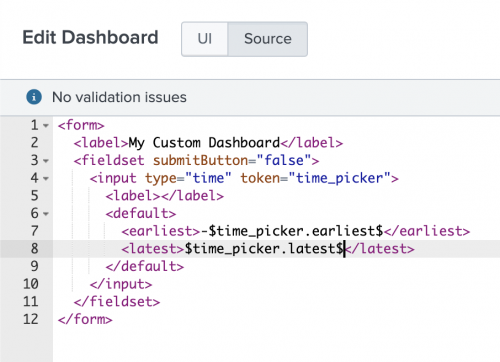
- Next, click Source on the Edit Dashboard menu.
- Locate the earliest and latest tags for your time input.
- Change the text within the tags using the following syntax, where
tokenis the unique token string you specified in your time input. Configuring the earliest and latest tags in the dashboard XML sets up the time picker in your dashboard to populate with the earliest and latest values from the URL for the entity detail page in ITSI.$token.earliest$$token.latest$
- Save the dashboard changes.


Next, you're ready to link to the dashboard and configure the time-range picker. Go to Configuration > Entities > Entity types. Edit the entity type and go to the Splunk dashboards section and follow the steps to link to a dashboard.
Link to a dashboard
- Click Select a dashboard and select a dashboard from your Splunk environment.
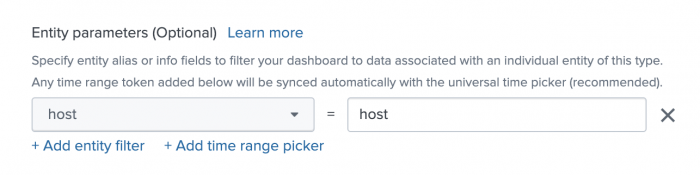
- (Optional) For custom dashboards, under Entity parameters, you can specify entity fields to filter the data in the dashboard. Configuring an entity field allows you to pass a parameter to a dashboard component to filter the dashboard data.
- Follow the prerequisite steps in the Configure entity tokens in your dashboards section of this topic.
- Click Add entity filter.
- From the dropdown, select the entity field that contains the data you want to pass.
- Enter the token for the dashboard component you want to pass the data to.
- Configure any additional entity fields.
- (Optional) For custom dashboards, under Entity parameters, there is also an option to add a time-range picker. Configuring a time-range picker allows you to sync to the time picker on the entity detail page to the dashboard; so, selections made within ITSI are synced to any time-range pickers in the dashboard.
- Follow the prerequisite steps in the Configure time-range picker tokens in your dashboards section of this topic.
- Click Add time-range picker.
- Enter the token name for the time picker you want to sync in the dashboard.
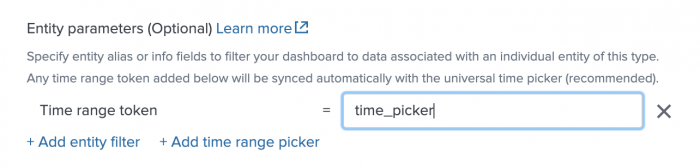
- Configure any additional time pickers.
- Click Add when you have finished configuring your dashboard.


Step 5: Add analysis data filters to your entity type
Analysis data filters determine which data sources you associate with the entity for visualizations in an entity's Analytics dashboard You can create filters to define data sources for metrics and logs here.
| Field | Description |
|---|---|
| Analysis data filter | Enter a name to reference the filter later. You can see metrics and events associated with each filter from the Analytics dashboard. You can add multiple static filters and entity filters to define as broad or specific an analysis data filter as needed. You can also include multiple analysis data filters for each entity type. |
| Type | Whether the filter is for metrics or events. Each filter can define data sources for only metrics or only events, not both. Add multiple filters to define data sources for metrics and events. |
| Static filter | Add field-value pairs to define a data source. This filter isn't entity-specific. It can be as broad or specific as you want it to be. For example, use region = us-west-1 to include data from every entity with a region field in us-west-1, use metric_name = windows.* to include entity data for all Windows metrics. To take it a step further, you could use metric_name = windows.CPUUtilization.average to view data about only average Windows CPU utilization. For event-based analysis filters, the fields you filter by must be indexed fields.
|
| Entity filter | Field-value pairs to define entities associated with data that's defined in the static filter. This filter is entity-specific. For example, you can use ip = 127.0.0.1. For event-based analysis filters, the fields you filter by must be indexed fields.
|
Click Save to save the analysis data filter and apply it to the entity type.
| Edit a default entity type in ITSI | Associate entities with an entity type in ITSI |
This documentation applies to the following versions of Splunk® IT Service Intelligence: 4.11.0, 4.11.1, 4.11.2, 4.11.3, 4.11.4, 4.11.5, 4.11.6, 4.12.0 Cloud only, 4.12.1 Cloud only, 4.12.2 Cloud only, 4.13.0, 4.13.1, 4.13.2, 4.13.3, 4.14.0 Cloud only, 4.14.1 Cloud only, 4.14.2 Cloud only, 4.15.0, 4.15.1, 4.15.2, 4.15.3, 4.16.0 Cloud only, 4.17.0, 4.17.1
Feedback submitted, thanks!