 Download topic as PDF
Dashboard reference
This topic provides an overview of the dashboards provided in the Splunk App for Microsoft Exchange. It describes each of the dashboard groups and available menu options, and provides links to additional information about each dashboard group.
Dashboards
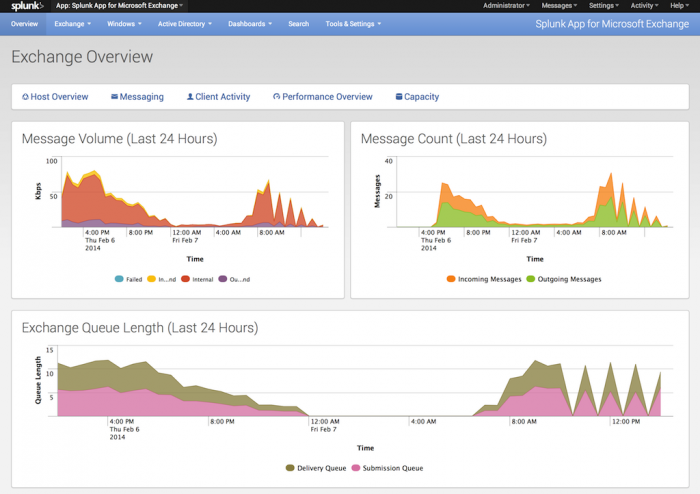
When you open the Splunk App for Microsoft Exchange, Splunk displays the Exchange Overview page. This page divides into several sections:
- Quick link panel: The panel underneath the Exchange Overview title gives you one-click access to all of your Exchange server metrics.
- Message Volume (Last 24 Hours): This panel displays a chart that depicts total message traffic volume, sorted into four groups: Failed messages, Inbound traffic, outbound traffic, and internal traffic.
- Message Count (Last 24 Hours): This panel displays a chart that shows the number of messages that have been transmitted in the last 24 hours, divided by incoming and outgoing.
- Exchange Queue Length (Last 24 Hours): This panel shows how well your Exchange environment is handling mail traffic by displaying the Exchange queue length. The chart displays both submission queue length (the amount of messages waiting for submission) and delivery queue length (the amount of messages waiting to be delivered).
- Additional Resources (not shown): The Additional Resources panel displays a link to this documentation. There's also a link to learn how to build your own custom dashboards.
Menus
The Splunk App for Microsoft Exchange also has several menu options which display in every page:
- Exchange - Provides access to all dashboards in the Exchange group.
- Windows - Provides access to all dashboards in the Windows group.
- Active Directory - Provides access to all dashboards in the Active Directory group.
- Dashboards - Takes you to the Dashboard Builder and App Dashboards series of pages. There, you can either view existing custom dashboards, or create new ones.
- Search - Opens a Search window which lets you use the Splunk search language to retrieve events from the data that the Splunk App for Microsoft Exchange has collected.
- Tools & Settings - Takes you to the Splunk App for Microsoft Exchange configuration page.
|
PREVIOUS Configure the Splunk App for Microsoft Exchange |
NEXT Host Performance Reports |
This documentation applies to the following versions of Splunk® App for Microsoft Exchange (EOL): 3.0, 3.0.1, 3.0.2, 3.0.3

Feedback submitted, thanks!