Components and their relationship with the network
Splunk Enterprise components require network connectivity to work properly if they have been distributed across multiple machines, and even in cases where the components are on one machine.
Splunk components communicate with each other using TCP and UDP network protocols. A firewall that has not been configured to allow these ports open can block communication between the Splunk instances.
Splunk software uses the following network ports to communicate between its components by default or by convention. You can perform a network port scan on a host to determine if it is listening on a port. Record open port numbers on your deployment diagram.
| Component | Purpose | Communicates on | Listens on |
|---|---|---|---|
| All components* | Management / REST API | N/A | TCP/8089 |
| Search head / Indexer | Splunk Web access | Any | TCP/8000 |
| Search head | App Key Value Store | Any | TCP/8065, TCP/8191 |
| Indexer | Receiving data from forwarders | N/A | TCP/9997 |
| Indexer cluster peer node / Search head cluster member | Cluster replication | N/A | TCP/9887 |
| Indexer/Forwarder | Network input (syslog) | N/A | UDP/514 |
Diagrams
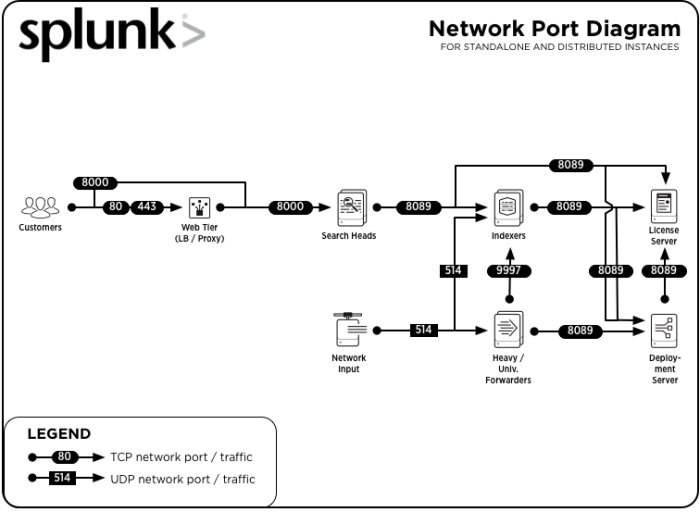
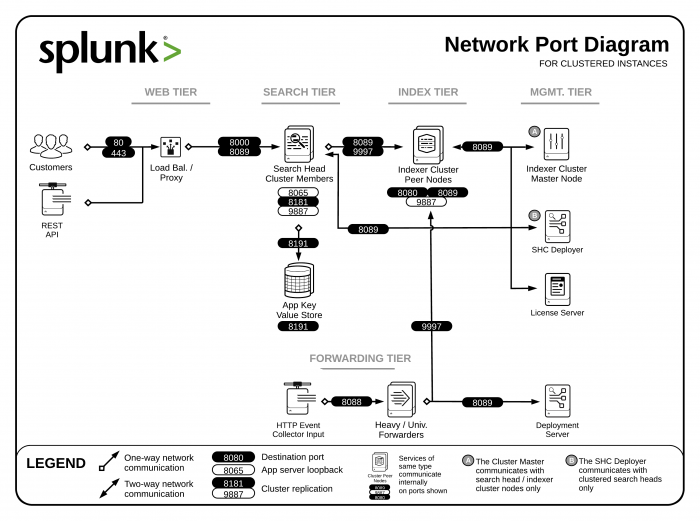
The following diagrams show the network ports that Splunk software listens on.
| Examine configuration files to determine your topology | Learn about the data in your Splunk deployment |
This documentation applies to the following versions of Splunk® Enterprise: 7.0.0, 7.0.1, 7.0.2, 7.0.3, 7.0.4, 7.0.5, 7.0.6, 7.0.7, 7.0.8, 7.0.9, 7.0.10, 7.0.11, 7.0.13


 Download manual
Feedback submitted, thanks!