Get started with metrics
The Splunk platform gathers metrics from different sources and stores this data into a new type of index that is optimized for ingestion and retrieval of metrics.
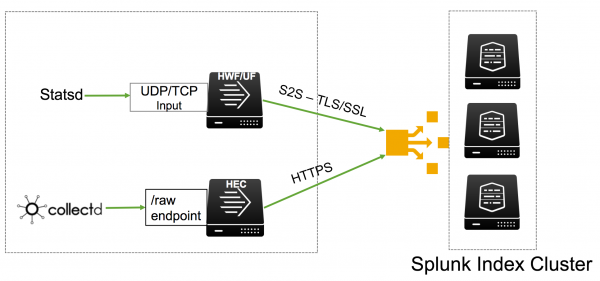
The Splunk platform supports the following metrics-gathering tools natively:
- The collectd agent, a Unix-based daemon, with the write_HTTP plugin. Collectd supports over 100 front-end plugins.
- The StatsD line protocol, which is used by a wide range of client libraries and other open source tools.
Both of these tools are lightweight and easy to use, and they have a large community of support. If you want to start gathering performance metrics from your applications and systems, review these tools to determine whether either of them suits your environment.
If you prefer to use a different metrics-gathering tool, you can still use the Splunk platform to collect and analyze your data with manual configuration.
Metrics data format
Metrics data uses a specific format with the following fields.
| Field | Required | Writable or Internal | Description | Example |
|---|---|---|---|---|
metric_name |
X | Writable | The metric name. | os.cpu.user |
_time |
X | Writable | The timestamp of the metric in UNIX time notation. | 2017-08-14 17:12:39.000 |
_value |
X | Writable | The numeric value of the metric. This field is a 64-bit floating point number, which supports precision between 15 and 17 decimal digits. | 42.12345 |
| <dimension 0> ... <dimension n> |
X | Writable | An arbitrary number of fields, indicating how metrics can be split. | ip |
_dims |
X | Internal | An auto-generated internal field that contains the names of all of the dimensions in the metric event. The purpose of this field is to return a list of unique dimension names in a metrics index. | _dims::ip |
metric_type |
Writable | The type of metric. Only g (gauge) is supported. |
g | |
source |
Internal | The source of the metrics data. | udp:8125 | |
host |
X | Internal | The origin host. A standard field in Splunk software. | server007 |
index |
X | Internal | The metrics index name. A standard field in Splunk software. | metricsindex |
sourcetype |
X | Internal | The data structure of the metric. A standard field in Splunk software. | statsd |
Supported line protocols
Metrics in the Splunk platform natively supports the following metric line protocols:
- Plain StatsD over UDP/TCP
- The StatsD extension with dimensions over UDP/TCP
- Collectd over HTTPS using HTTP Event Collector (HEC)
For details about getting data in, see Get metrics in from StatsD and Get metrics in from collectd.
To support other line metric protocols, you can use custom transformations to get metrics data into Splunk platform from other tools. For details, see Get metrics from other clients.
Metrics source types
The Splunk platform includes the following pre-trained source types to support the most widely-supported line metric protocols:
| Source type name | Description |
|---|---|
| statsd | Supports data using the metric line protocols for plain StatsD and the StatsD extension with dimensions. |
| collectd_http | Supports data using the metric line protocol for collectd. |
| metrics_csv | Supports data in CSV format. For usage details, see Get metrics in from other sources. |
Metrics indexes
To store and analyze metrics data as efficiently as possible, metrics data is stored in a new type of index just for metrics. A metrics index can be used only for metrics data. You cannot convert an events index to a metrics index, or vice versa.
To learn more, see Create metrics indexes in the Managing Indexers and Clusters of Indexers manual.
For information about how metrics data is metered, see How Splunk Enterprise licensing works in the Admin Manual.
Default metrics indexes
You can assign default metrics indexes to user roles. See Add and edit roles with Splunk Web in Securing Splunk.
When you run a search with metrics commands such as mcatalog or mstats and you do not filter the search by a specific index, the search automatically searches the default indexes assigned to your role. If you run a metrics search that does not filter by a specific metrics index and you have no default metrics indexes assigned to your role, the metrics search runs over an empty dataset.
Search and CLI commands with metrics
To analyze data and enumerate items in a metrics index, use the mstats and mcatalog search commands. Other search commands that work with events do not work with metrics. For example, the delete command does not work with metrics. For more about searching a metrics index, see Search and monitor metrics.
Administrative CLI commands may not all work with metrics. You can use commands such as add index and list index with metrics when using the -datatype metric parameter. See Create metrics indexes in the Managing Indexers and Clusters of Indexers manual.
| Overview of metrics | Get metrics in from StatsD |
This documentation applies to the following versions of Splunk® Enterprise: 7.1.0, 7.1.1, 7.1.2, 7.1.3, 7.1.4, 7.1.5, 7.1.6, 7.1.7, 7.1.8, 7.1.9, 7.1.10, 7.2.0, 7.2.1

 Download manual
Feedback submitted, thanks!