About proactive Splunk component monitoring
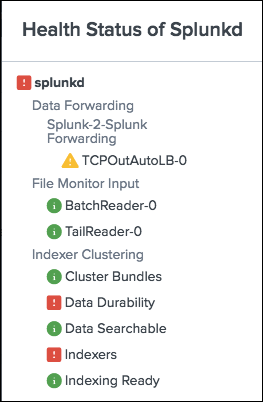
Proactive Splunk component monitoring lets you view the health of Splunk Enterprise features from the output of a REST API endpoint. Individual features report their health status through a tree structure that provides a continuous, real-time view of the health of your deployment.
You can access feature health information using the splunkd health report in Splunk Web. See View the splunkd health report.
You can also access feature health information programmatically from the server/health/splunkd endpoint. See Query the server/health/splunkd endpoint.
For more information on the splunkd process, see Splunk Enterprise Processes.
How it works
Proactive Splunk component monitoring records the health status of splunkd in a tree structure, where leaf nodes represent particular Splunk Enterprise features, and intermediary nodes categorize the various features. Feature health status is color-coded in three states:
- Green: The feature is functioning properly.
- Yellow: The feature is experiencing a problem.
- Red: The feature has a severe issue and is negatively impacting the functionality of your deployment.
The health status tree structure
The splunkd health status tree has the following nodes:
| Health status tree node | Description |
|---|---|
| splunkd | The top level node of the status tree shows the overall health status (color) of splunkd. The status of splunkd shows the least healthy state present in the tree. The REST endpoint retrieves the instance health from the splunkd node.
|
| Feature categories | Feature categories represent the second level in the health status tree. Feature categories are logical groupings of features. For example, "BatchReader" and "TailReader" are features that form a logical grouping with the name "File Monitor Input". Feature categories act as buckets for groups of features, and do not have their own health status. |
| Features | The next level in the status tree is feature nodes. Each node contains information on the health status of a particular feature. Each feature contains one or more indicators that determine the status of the feature. The overall health status of a feature is based on the least healthy color of any of its indicators. |
| Indicators | Indicators are the fundamental elements of the splunkd health report. These are the lowest levels of functionality that are tracked by each feature, and change colors as functionality changes. Indicator values are measured against red or yellow threshold values to determine the status of the feature. See What determines the status of a feature?
|
For a list of features that proactive Splunk component monitoring supports, see Supported Splunk Enterprise features.
What determines the status of a feature?
The current status of a feature in the status tree depends on the value of its associated indicators. Indicators have configurable thresholds for yellow and red. When an indicator's value meets threshold conditions, the feature's status changes.
For information on how to configure indicator status thresholds, see Set indicator threshold values.
Health status viewpoint
The splunkd status tree shows the health of your Splunk Enterprise deployment from the viewpoint of the instance type that you are monitoring. For example, in an indexer cluster environment, the cluster master and peer nodes each show a different set of features contributing to the overall health of splunkd.
| Forwarders | Requirements |
This documentation applies to the following versions of Splunk® Enterprise: 7.1.0, 7.1.1, 7.1.2, 7.1.3, 7.1.4, 7.1.5, 7.1.6, 7.1.7, 7.1.8, 7.1.9, 7.1.10

 Download manual
Feedback submitted, thanks!