About the Monitoring Console
What is the Monitoring Console?
The Monitoring Console is the Splunk Enterprise monitoring tool. It lets you view detailed topology and performance information about your Splunk Enterprise deployment. Before Splunk Enterprise version 6.5.0, the Monitoring Console was called the Distributed Management Console.
The available dashboards provide insight into the following areas of your deployment or instance:
- search performance and distributed search framework
- indexing performance
- operating system resource usage
- Splunk app key value store performance
- search head and indexer clustering
- index and volume usage
- forwarder connections and Splunk TCP performance
- HTTP Event Collector performance
- and license usage.
The Monitoring Console dashboards use data from Splunk Enterprise's internal log files such as metrics.log, as well as data available from Splunk Enterprise platform instrumentation.
Find the Monitoring Console
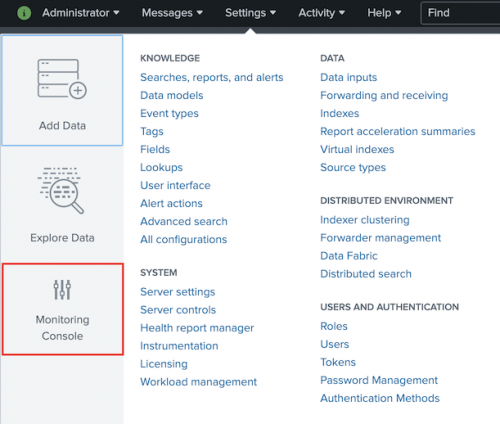
From anywhere in Splunk Web, click Settings, and then click the Monitoring Console icon on the left.
The Monitoring Console is visible only to users with the Splunk Enterprise admin role.
For information about the Monitoring Console in Splunk Cloud Platform, see Introduction to the Cloud Monitoring Console in the Splunk Cloud Platform Admin Manual.
| Monitoring Splunk Enterprise overview | What can the Monitoring Console do? |
This documentation applies to the following versions of Splunk® Enterprise: 8.0.0, 8.0.1, 8.0.2, 8.0.3, 8.0.4, 8.0.5, 8.0.6, 8.0.7, 8.0.8, 8.0.9, 8.0.10, 8.1.0, 8.1.1, 8.1.2, 8.1.3, 8.1.4, 8.1.5, 8.1.6, 8.1.7, 8.1.8, 8.1.9, 8.1.10, 8.1.11, 8.1.12, 8.1.13, 8.1.14, 8.2.0, 8.2.1, 8.2.2, 8.2.3, 8.2.4, 8.2.5, 8.2.6, 8.2.7, 8.2.8, 8.2.9, 8.2.10, 8.2.11, 8.2.12, 9.0.0, 9.0.1, 9.0.2, 9.0.3, 9.0.4, 9.0.5, 9.0.6, 9.0.7, 9.0.8, 9.0.9, 9.0.10, 9.1.0, 9.1.1, 9.1.2, 9.1.3, 9.1.4, 9.1.5, 9.1.6, 9.1.7, 9.1.8, 9.1.9, 9.2.0, 9.2.1, 9.2.2, 9.2.3, 9.2.4, 9.2.5, 9.2.6, 9.3.0, 9.3.1, 9.3.2, 9.3.3, 9.3.4, 9.4.0, 9.4.1, 9.4.2

 Download manual
Feedback submitted, thanks!