Investigate feature health status changes
There are two ways to access feature health status information from the /server/health/splunkd endpoint:
- View the
splunkdhealth report in Splunk Web. - Query the
server/health/splunkdendpoint.
You can also monitor feature health status changes in $SPLUNK_HOME/var/log/health.log. For more information on health.log file entries, see Configure health status logs.
View the splunkd health report
The splunkd health report lets you view the current status of features in the splunkd health status tree. You can use the report to identify features whose status indicates a problem, and investigate the cause of those problems.
To view the splunkd health report in Splunk Web:
- On the instance you want to monitor, log in to Splunk Web.
- In the main menu, check the color of the health report icon. The color of this icon indicates the overall status of
splunkd. - Click the health report icon to open the health report.
- In the health status tree, click on any feature to view information about the feature's status.
- For features in the red or yellow state, review Root Cause for information that can help you identify the cause of a feature's status change. Additionally, click Generate Diag to generate diag files to attach to a support case. Admins have
get_diagby default and can grant other users the capability to open the RapidDiag app. For more details, see RapidDiag in the Splunk Enterprise Troubleshooting Manual.
Example
This example shows how you can use the splunkd health report to investigate feature health status changes on a cluster manager instance.
- Review the splunkd health report.
- Investigate root cause and related messages.
- Confirm the cause of feature status change.
1. Review the splunkd health report
- On the cluster manager instance, log in to Splunk Web.
- Check the color of the health report icon in the main menu. A red icon indicates that one or more features in the
splunkdhealth status tree has a severe issue.
- Click the health report icon to open the health report. The following health report indicates that the
data_durabilityfeature in theIndexer Clusteringcategory has a severe issue:
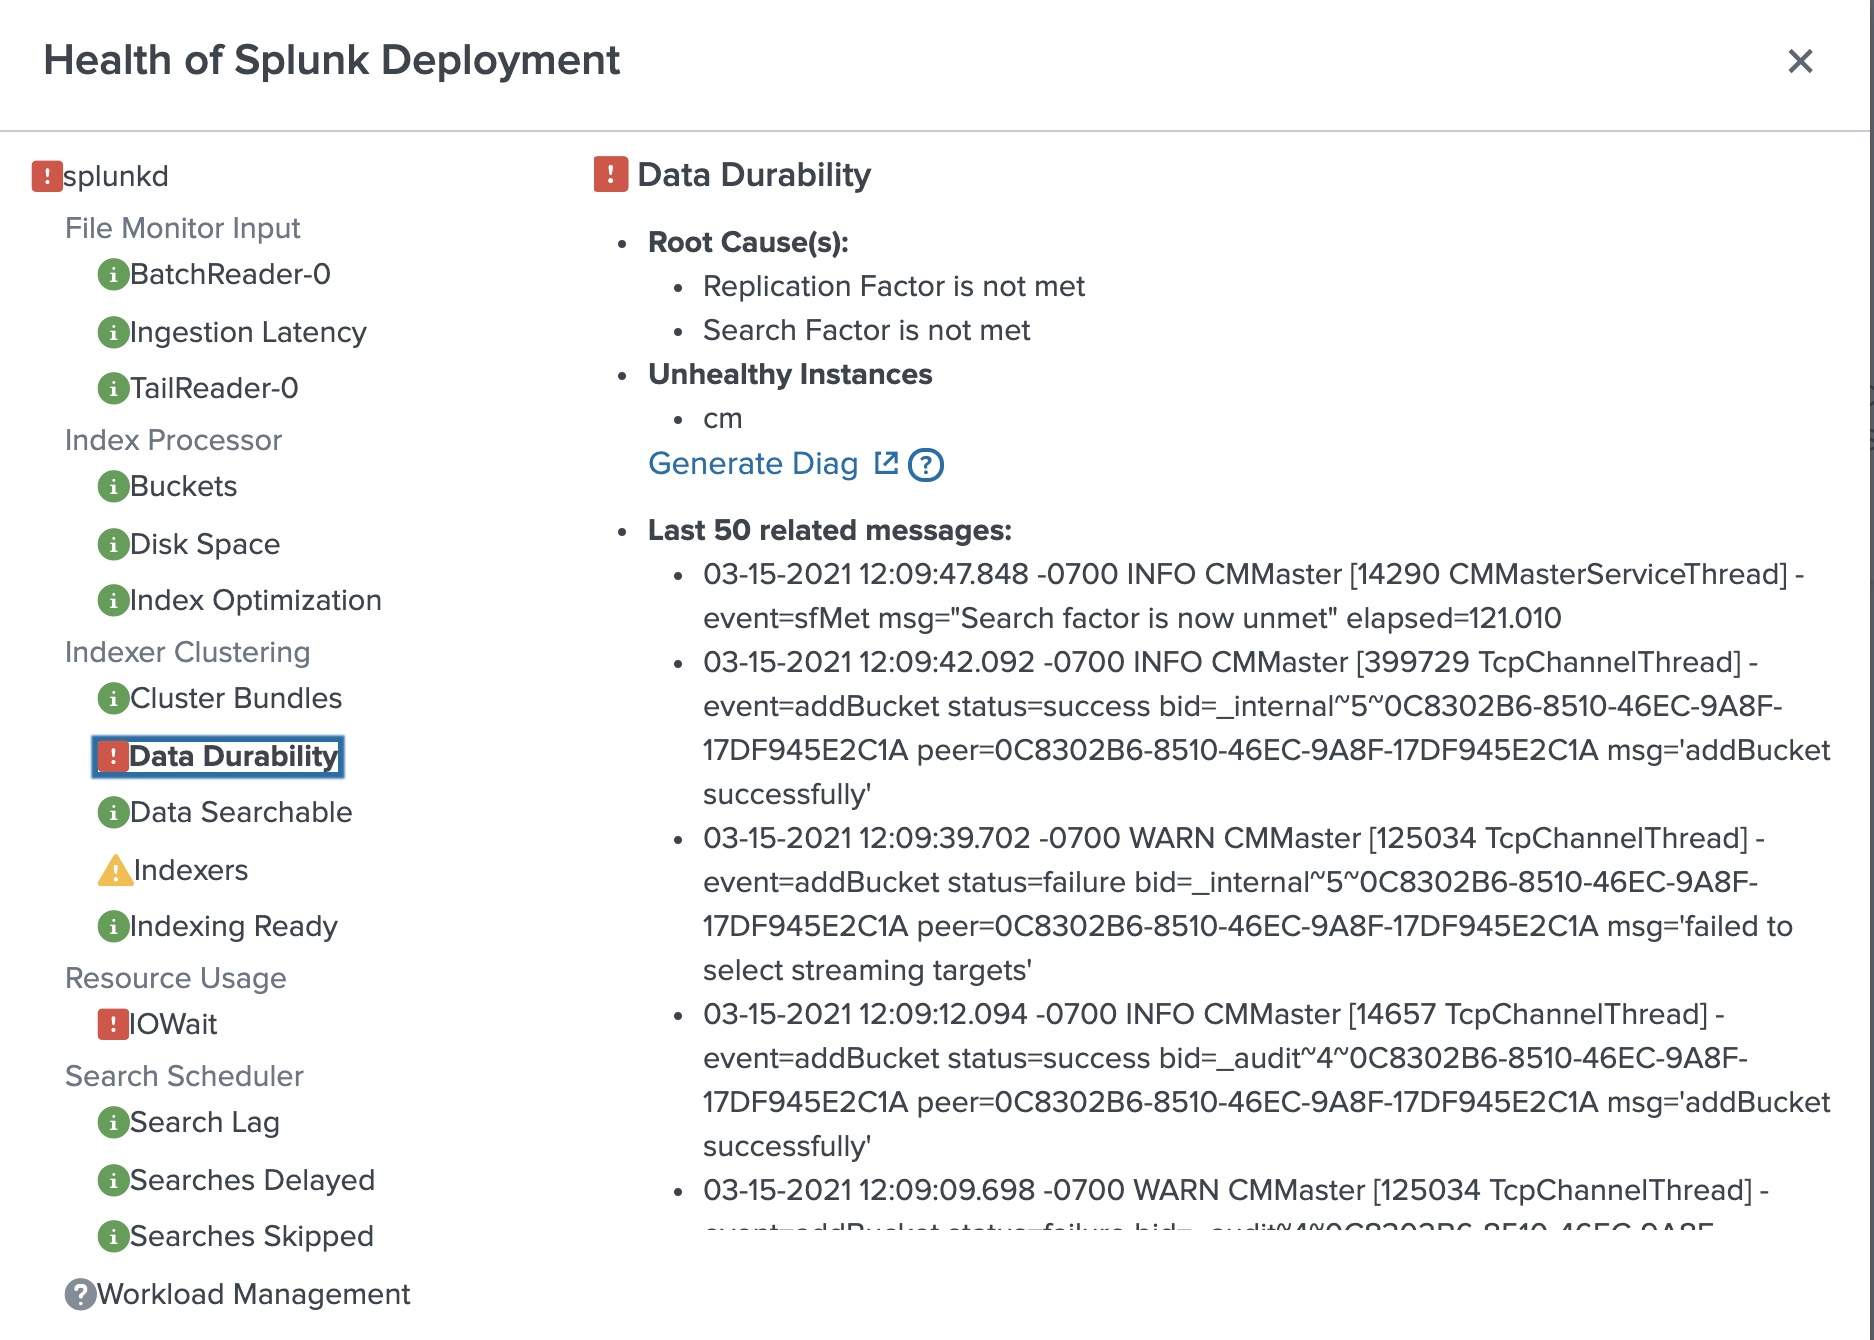

In the health status tree, click the data_durability feature. The following diagnostic information appears:
Root Cause: "Replication Factor is not met."
If the number of peers in the cluster is less than the replication factor, the replication factor cannot be met. Therefore a possible cause of the feature's red status is an offline peer.
Last 50 Related Messages: Searching the related messages, you see log entries that contain streaming errors. For example:
03-15-2021 12:09:12.094 -0700 WARN CMMaster [125034 TcpChannelThread] - event=addBucket status=failure bid=_internal~5~0C8302B6-8510-46EC-9A8F-17DF945E2C1A peer=0C8302B6-8510-46EC-9A8F-17DF945E2C1A msg='failed to select streaming targets'
The streaming error suggests that bucket replication is failing because a source peer cannot communicate with a target peer. This type of error can be caused by a network interruption or an offline peer.
3. Confirm the cause of feature status change
After you use the splunkd health report to investigate the cause of the feature's status change, which suggests a peer is offline, you can use the Monitoring Console to check the status of cluster peers and confirm if the suspected cause is correct.
- In Splunk Web, click Settings > Monitoring Console.
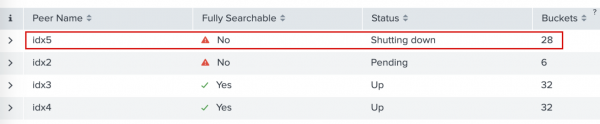
- Click Indexing > Indexer Clustering > Indexer Clustering: Status.
The dashboard shows that the peer nodeidx5is stopped.
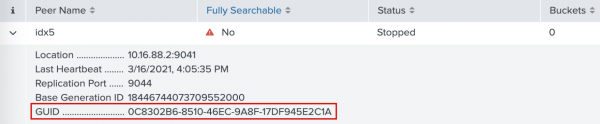
- Click on the
idx5peer to see more information. Theidx5peer GUID matches the GUID of the target peer in the streaming error message. This confirms that the cause of thedata_durabilityfeature's red status is an offline peer.
- You can now take steps to restart the peer and have it rejoin the cluster, which returns the
data_durabilityfeature to the green state.


Query the server/health/splunkd endpoint
You can integrate proactive Splunk component monitoring with existing third-party monitoring tools and other applications.
To see the overall health status of splunkd, query the server/health/splunkd endpoint. For example:
curl -k -u admin:pass https://<host>:8089/services/server/health/splunkd
For endpoint details, see server/health/splunkd in the REST API Reference Manual.
To see the overall health of splunkd, as well as the health of each feature reporting to the status tree, and information on feature health status changes, query server/health/splunkd/details. For example:
curl -k -u admin:pass https://<host>:8089/services/server/health/splunkd/details
For endpoint details, see server/health/splunkd/details in the REST API Reference Manual.
For more information on how to use Splunk REST API endpoints, see Connecting to splunkd in the REST API User Manual.
For information on Splunk SDKs that support the Splunk REST API, see Splunk Enterprise SDKs.
| Set access controls for the splunkd health report |
This documentation applies to the following versions of Splunk® Enterprise: 8.2.0, 8.2.1, 8.2.2, 8.2.3, 8.2.4, 8.2.5, 8.2.6, 8.2.7, 8.2.8, 8.2.9, 8.2.10, 8.2.11, 8.2.12, 9.0.0, 9.0.1, 9.0.2, 9.0.3, 9.0.4, 9.0.5, 9.0.6, 9.0.7, 9.0.8, 9.0.9, 9.0.10, 9.1.0, 9.1.1, 9.1.2, 9.1.3, 9.1.4, 9.1.5, 9.1.6, 9.1.7, 9.2.0, 9.2.1, 9.2.2, 9.2.3, 9.2.4, 9.3.0, 9.3.1, 9.3.2, 9.4.0
Feedback submitted, thanks!