How data moves through Splunk deployments: The data pipeline
The processing tiers in a Splunk deployment correspond to the data pipeline, which is the route that data takes through Splunk software.
The processing tiers and the data pipeline
A Splunk deployment typically has three processing tiers:
- Data input
- Indexing
- Search management
See "Scale your deployment with Splunk Enterprise components."
Each Splunk processing component resides on one of the tiers. Together, the tiers support the processes occurring in the data pipeline.
As data moves along the data pipeline, Splunk components transform the data from its origin in external sources, such as log files and network feeds, into searchable events that encapsulate valuable knowledge.
The data pipeline has these segments:
The correspondence between the three typical processing tiers and the four data pipeline segments is this:
- The data input tier handles the input segment.
- The indexing tier handles the parsing and indexing segments.
- The search management tier handles the search segment.
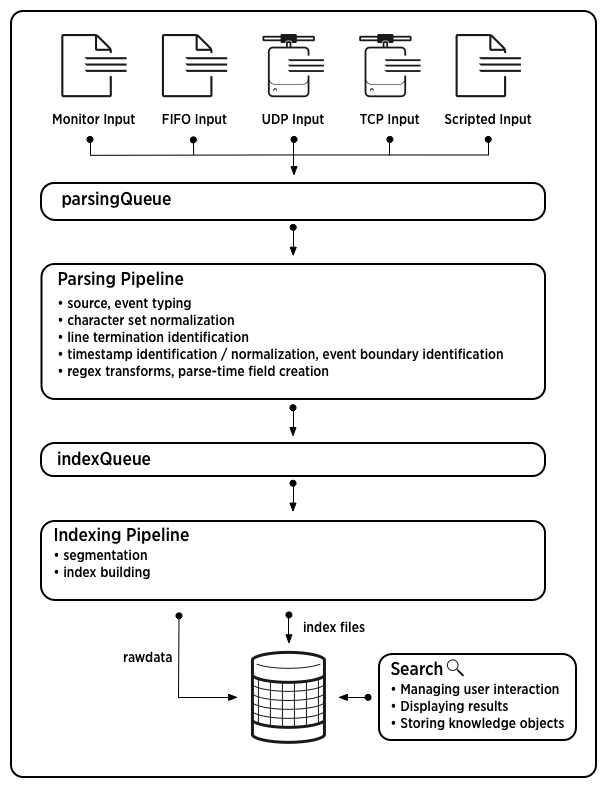
This diagram outlines the data pipeline:
Splunk components participate in one or more segments of the data pipeline. See "Components and the data pipeline."
Note: The diagram represents a simplified view of the indexing architecture. It provides a functional view of the architecture and does not fully describe Splunk software internals. In particular, the parsing pipeline actually consists of three pipelines: parsing, merging, and typing, which together handle the parsing function. The distinction can matter during troubleshooting, but does not ordinarily affect how you configure or deploy Splunk Enterprise components. For more detailed diagrams of the data pipeline, see "Diagrams of how indexing works in the Splunk platform" on the Splunk Community site.
The data pipeline segments in depth
This section provides more detail about the segments of the data pipeline. For more information on the parsing and indexing segments, see also "How indexing works" in the Managing Indexers and Clusters of Indexers manual.
Input
In the input segment, Splunk software consumes data. It acquires the raw data stream from its source, breaks it into 64K blocks, and annotates each block with some metadata keys. The keys apply to the entire input source overall. They include the host, source, and source type of the data. The keys can also include values that are used internally, such as the character encoding of the data stream, and values that control later processing of the data, such as the index into which the events should be stored.
During this phase, Splunk software does not look at the contents of the data stream, so the keys apply to the entire source, not to individual events. In fact, at this point, Splunk software has no notion of individual events at all, only of a stream of data with certain global properties.
Parsing
During the parsing segment, Splunk software examines, analyzes, and transforms the data. This is also known as event processing. It is during this phase that Splunk software breaks the data stream into individual events.The parsing phase has many sub-phases:
- Breaking the stream of data into individual lines.
- Identifying, parsing, and setting timestamps.
- Annotating individual events with metadata copied from the source-wide keys.
- Transforming event data and metadata according to regex transform rules.
Indexing
During indexing, Splunk software takes the parsed events and writes them to the index on disk. It writes both compressed raw data and the corresponding index files.
For brevity, parsing and indexing are often referred together as the indexing process. At a high level, that makes sense. But when you need to examine the actual processing of data more closely or decide how to allocate your components, it can be important to consider the two segments individually.
Search
The search segment manages all aspects of how the user accesses, views, and uses the indexed data. As part of the search function, Splunk software stores user-created knowledge objects, such as reports, event types, dashboards, alerts, and field extractions. The search function also manages the search process itself.
Where to go next
While the data pipeline processes always function in approximately the same way, no matter the size and nature of your deployment, it is important to take the pipeline into account when designing your deployment. For that, you must understand how Splunk components map to the data pipeline segments. See "Components and the data pipeline."
| Use clusters for high availability and ease of management | Components and the data pipeline |
This documentation applies to the following versions of Splunk® Enterprise: 7.0.0, 7.0.1, 7.0.2, 7.0.3, 7.0.4, 7.0.5, 7.0.6, 7.0.7, 7.0.8, 7.0.9, 7.0.10, 7.0.11, 7.0.13, 7.1.0, 7.1.1, 7.1.2, 7.1.3, 7.1.4, 7.1.5, 7.1.6, 7.1.7, 7.1.8, 7.1.9, 7.1.10, 7.2.0, 7.2.1, 7.2.2, 7.2.3, 7.2.4, 7.2.5, 7.2.6, 7.2.7, 7.2.8, 7.2.9, 7.2.10, 7.3.0, 7.3.1, 7.3.2, 7.3.3, 7.3.4, 7.3.5, 7.3.6, 7.3.7, 7.3.8, 7.3.9, 8.0.0, 8.0.1, 8.0.2, 8.0.3, 8.0.4, 8.0.5, 8.0.6, 8.0.7, 8.0.8, 8.0.9, 8.0.10, 8.1.0, 8.1.1, 8.1.2, 8.1.3, 8.1.4, 8.1.5, 8.1.6, 8.1.7, 8.1.8, 8.1.9, 8.1.10, 8.1.11, 8.1.12, 8.1.13, 8.1.14, 8.2.0, 8.2.1, 8.2.2, 8.2.3, 8.2.4, 8.2.5, 8.2.6, 8.2.7, 8.2.8, 8.2.9, 8.2.10, 8.2.11, 8.2.12, 9.0.0, 9.0.1, 9.0.2, 9.0.3, 9.0.4, 9.0.5, 9.0.6, 9.0.7, 9.0.8, 9.0.9, 9.0.10, 9.1.0, 9.1.1, 9.1.2, 9.1.3, 9.1.4, 9.1.5, 9.1.6, 9.1.7, 9.1.8, 9.2.0, 9.2.1, 9.2.2, 9.2.3, 9.2.4, 9.2.5, 9.3.0, 9.3.1, 9.3.2, 9.3.3, 9.4.0, 9.4.1

 Download manual
Feedback submitted, thanks!