Investigate counter metrics
Counter metrics are one of the most common metric types. A counter metric has a value that always increases when it changes, except when it is reset to zero on restart. In other words, it increases monotonically.
You use counter metrics to count things. Automobile odometers provide a simple example of a counter metric. Odometers indicate the number of miles that a car has been driven. Odometer values never go down, except when they are reset to zero.
Counter metrics tend to count events. For example, most networking metrics involve event counts, whether you are talking about website visits, network interface errors, packets sent or received, or disk operations.
Periodic and accumulating counters
There are two types of counter metrics: periodic counters and accumulating counters. The following table describes these metric types, lists the metric protocols that they are associated with, and lists the key SPL that you use to query them.
| Counter Metric Type | Description | Metric Line Protocols | SPL used to query |
|---|---|---|---|
| Periodic | The client resets the value of the counter to zero each time it sends a measurement to the server, meaning that each data point is independent. | StatsD, collectd ABSOLUTE, collectd DERIVE (storerates=true) | Use mstats, stats, or tstats with sum(x), or timechart with per_*(x).
|
| Accumulating | The value of the counter is reset to zero only when the service is reset. Each new value is added to the last one. You can compare two measurements to get the rate of accumulation. | collectd COUNTER, collectd DERIVE (storerates=false) | If your Splunk platform version is 7.2.x or higher, use mstats with rate(x). If your Splunk platform version is 7.0.x or 7.1.x, use streamstats with latest(x) and eval.
|
Sum up periodic counters
Because of the way that periodic counters are reset to zero each time the metrics client sends them to the Splunk platform, they are reported as a series of independent measurements. To see how these measurements work as a counter, you run a mstats, stats, or tstats search that aggregates them with the sum(x) function. Alternatively you could run a timechart search that aggregates them with one of the per_*(x) functions.
Get the count rate for an accumulating counter
People who track accumulating counter metrics often find the count rate over time to be a more interesting measurement than the count over time. The count rate tells you when metric activity is speeding up or slowing down, and that can be significant information for some metrics.
The manner in which you determine counter rates depends mostly on the version of your Splunk platform implementation. If you are using 7.0.x or 7.1.x, you use streamstats in conjunction with latest(x) and eval to return the rate of an accumulating counter. If your Splunk platform implementation is version 7.2.x or higher, you use mstats with the rate(x) function to get the counter rate.
The two methods of getting the counter rate return slightly different results. This happens because they compare different sets of count values.
| Rate determination method | Count value difference used in rate calculation | Example |
|---|---|---|
streamstats, the latest(x) function, and eval
|
Uses the difference between the count value of the latest event in the preceding timespan and the count value of the latest event in the current timespan | if your timespan is 1h, to get the rate for 2 P.M. you would get the latest event for the 1 P.M. - 2 P.M. timespan and compare it against the latest event for the 2 P.M. - 3 P.M. timespan.
|
mstats with the rate(x) function
|
Uses the difference between the count value of the earliest event in a timespan and the count value of the latest event in the same timespan. | If your timespan is 1h, to get the rate for 2 P.M. you would take the earliest event from the 1 P.M. - 2 P.M. timespan and compare it to the latest event in the 1 P.M. - 2 P.M. timespan.
|
When constructing SPL for a counter rate search, make sure that you do not mix counter metrics. If you need to report on multiple counter metrics, use the BY clause to separate them. You should also set name=indexerpipe processor=index_thruput to keep the focus on one specific counter metric.
Use streamstats, latest(x), and eval to return counter rate
Use streamstats, the latest(x) function, and eval if your Splunk platform version is 7.0.x or 7.1.x, or if you have a scenario for which the rate(x) function is inappropriate. You might stick to streamstats if you can't count on having two metric data points per timespan, for example.
When you use this method, be sure to set current=f to force the search to use the latest value from the previous timespan.
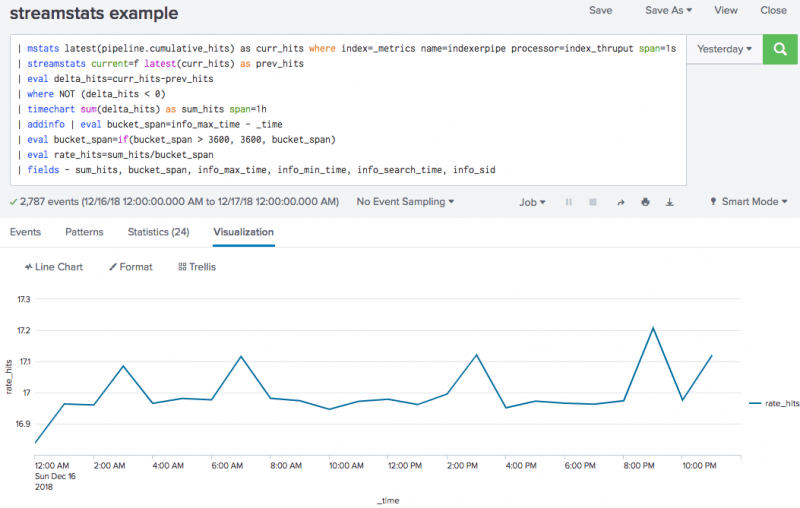
Here is an example of a counter rate search that uses streamstats, latest(x), and eval for its calculations:
| mstats latest(pipeline.cumulative_hits) as curr_hits where index=_metrics
name=indexerpipe processor=index_thruput span=1s
| streamstats current=f latest(curr_hits) as prev_hits
| eval delta_hits=curr_hits-prev_hits
| where NOT (delta_hits < 0)
| timechart sum(delta_hits) as sum_hits span=1h
| addinfo | eval bucket_span=info_max_time - _time
| eval bucket_span=if(bucket_span > 3600, 3600, bucket_span)
| eval rate_hits=sum_hits/bucket_span
| fields - sum_hits, bucket_span, info_max_time, info_min_time, info_search_time, info_sid
And here is an example of the line chart returned by this search.
Walkthrough
Here is a step-by-step walkthrough of that example search.
- Use a combination of
mstats,streamstats, andevalto get the delta count on each second.
| mstats latest(pipeline.cumulative_hits) as curr_hits where index=_metrics name=indexerpipe processor=index_thruput span=1s
| streamstats current=f latest(curr_hits) as prev_hits
| eval delta_hits=curr_hits-prev_hits
| where NOT (delta_hits < 0)
Note thatstreamstatsusescurrent=f. This forces the search to use the latest value from the previous timespan. - Calculate the sum of the delta counts for each hour.
| timechart sum(delta_hits) as sum_hits span=1h
- Calculate the time span of the bucket. It should be 1h, unless it is the last bucket, in which case it can be less than 1h.
| addinfo | eval bucket_span=info_max_time - _time
| eval bucket_span=if(bucket_span > 3600, 3600, bucket_span)
- Lastly, calculate the rate with the following function
rate = delta_count/time_range.
| eval rate_hits=sum_hits/bucket_span
| fields - sum_hits, bucket_span, info_max_time, info_min_time, info_search_time, info_sid
Use mstats with the rate(x) function to return counter rate
Use mstats in conjunction with the rate(x) function to determine counter rates if you are using Splunk platfom version 7.2.x or higher.
To get a proper rate measurement with mstats and rate(x) you need to have at least two counter events per time span in your search. The Splunk platform uses the difference between those two values to determine the actual rate. If you cannot guarantee that there will be two metric data points per timespan you might instead use the streamstats method.
The rate(x) function uses the following calculation to derive its value:
(latest(<counter_field>) - earliest(<counter_field>)) / (latest_time(<counter_field>) - earliest_time(<counter_field>))
See Time functions in the Search Reference for more information about these functions.
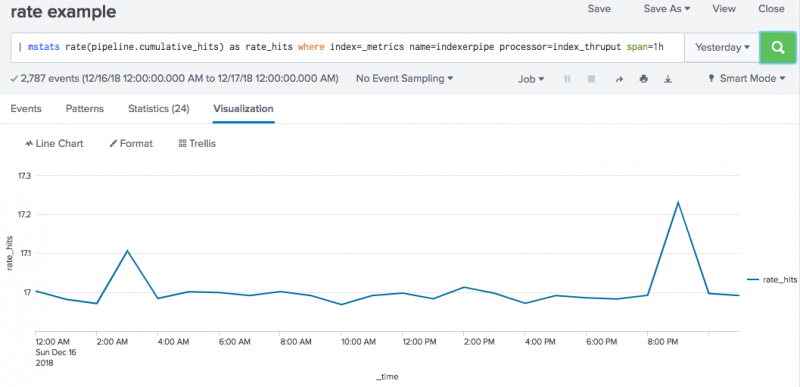
Here is an example of a counter rate search that uses mstats and rate(x) to get counter rates.
| mstats rate(pipeline.cumulative_hits) as rate_hits where index=_metrics name=indexerpipe processor=index_thruput span=1h
And here is an example of the line chart returned by this search.
Calculate average and aggregate rates for accumulating counter metrics
Use the rate_avg(X) and rate_sum(X) functions to derive the average and aggregate rates for accumulating counter metrics. These functions both take metric time series into account to improve the accuracy of the calculation. The functions first calculate the rate of the metric, grouped by metric time series. Then they produce either the average or the aggregation of those metric time series depending on the function you are using.
These functions take a relatively complicated search that utilizes the _timeseries field such as this:
| mstats rate(spl.mlog.thruput.thruput.total_k_processed) where index=_metrics BY _timeseries | spath input=_timeseries | stats sum(rate(spl.mlog.thruput.thruput.total_k_processed)) span=1h
And transforms it into a simpler search like this:
| mstats rate_sum(spl.mlog.thruput.thruput.total_k_processed) where index=_metrics span=1h
The rate_avg(X) and rate_sum(X) functions have the additional benefit of being able to compute rates even if there is only a single metric data point per metric time series per timespan. The functions can pull in data across timespans to compute rates.
For more information about metric time series and the _timeseries field, see Perform statistical calculations on metric time series.
For more information about the rate_avg(X) and rate_sum(X) functions, see Time functions in the Search reference.
| Perform statistical calculations on metric time series | Use histogram metrics |
This documentation applies to the following versions of Splunk® Enterprise: 8.1.0, 8.1.1, 8.1.2, 8.1.3, 8.1.4, 8.1.5, 8.1.6, 8.1.7, 8.1.8, 8.1.9, 8.1.10, 8.1.11, 8.1.12, 8.1.13, 8.1.14, 8.2.0, 8.2.1, 8.2.2, 8.2.3, 8.2.4, 8.2.5, 8.2.6, 8.2.7, 8.2.8, 8.2.9, 8.2.10, 8.2.11, 8.2.12, 9.0.0, 9.0.1, 9.0.2, 9.0.3, 9.0.4, 9.0.5, 9.0.6, 9.0.7, 9.0.8, 9.0.9, 9.0.10, 9.1.0, 9.1.1, 9.1.2, 9.1.3, 9.1.4, 9.1.5, 9.1.6, 9.1.7, 9.2.0, 9.2.1, 9.2.2, 9.2.3, 9.2.4, 9.3.0, 9.3.1, 9.3.2, 9.4.0


 Download manual
Feedback submitted, thanks!