Create and edit reports
When you create a search or a pivot that you would like to run again or share with others, you can save it as a report. This means that you can create reports from both the Search and the Pivot sides of the Splunk platform.
Once you create a report you can:
- View the results that the report returns on the report viewing page or Splunk Mobile. You can get to the viewing page for a report by clicking the name of the report on the Reports listing page. See View reports in Splunk Mobile in the Download and Use Splunk Mobile manual to learn more about viewing reports on your mobile device.
- Open the report and edit it so that it returns different data or displays its data in a different manner. Your report opens in either Pivot or Search, depending on how it was created.
In addition, if your permissions enable you to do so, you can:
- Change the report permissions to share it with other Splunk users. See Set report permissions, in this manual.
- Schedule the report so that it runs on a regular interval. Scheduled reports can perform actions each time they run, such as sending report results via email to a set of stakeholders. See Schedule reports, in this manual.
- Accelerate slow-completing reports built in Search. See Accelerate reports, in this manual.
- Embed scheduled reports in external websites. See Embed scheduled reports, in this manual.
- Add the report to a dashboard as a dashboard panel. See Add reports and saved searches from the Reports tab in the Dashboard Studio manual.
Note: Permissions for reports built via Pivot must match those of the data model that was used to construct them. See "Permissions for Pivot-based reports,", in this manual.
Manually create a report in Splunk Web
You can create reports via Splunk Web in four ways:
- From Search, by saving a search as a report.
- From Pivot, by saving a pivot as a report.
- By selecting Settings > Searches, reports, and alerts and clicking New Report to add a new report.
- From a dashboard, by converting an inline-search-powered dashboard panel to a report.
See the following subsections for more information about these report creation methods.
Save a search or pivot as a report from the Search or Pivot views
When you design a search or pivot that returns useful results, you can save it as a report. The report retains any formatting that you set up for the original search, including chart visualizations and event list display options.
Note: You can only save a search as a report when it is running, paused, finalized, or completed.
- Run a search or design a pivot that is worth saving as a report.
- Click Save As and select Report. to save the search or pivot as a report. The report retains any formatting that you set up for the original search, including chart visualizations and event list display options.
- Provide a unique Title for the report. Supported characters for titles are a-z, A-Z, 0-9, or _.
To avoid confusion with federated search syntax, do not give reports titles that begin with federated:.
- (Optional) Provide a Description of the report.
- (Optional) Add a time range picker to the report. A time range picker allows users without write permissions to rerun the report over a different time range without actually editing it.
If you do not provide a time range picker, the report always runs over the same time range as the original search. To change the time range, a user with edit permissions for the report must open it in Search, update its time range, and save that edit.
The time range picker option is unavailable for scheduled reports, which always display the results returned by their last scheduled run. If you schedule a report that has a time range picker, the time range picker disappears. See Schedule reports. - Click Save to save the search as a report.
When you save a search as a report, you can:
- View or run the report and see results it returns on the report viewing page.
- Share your report with others by changing its permissions.
- Arrange to have the report run on a schedule.
- Accelerate the report, so that it completes faster when it is run again.
- Embed the report in an external website. Only scheduled reports can be embedded.
- Continue editing the report.
- Add the report to a dashboard. in the Dashboard Studio manual.
Create a new report in Settings
You can manually create new reports in Settings.
Prerequisites
Steps
- Select Settings > Searches, reports, and alerts
- Click New Report.
- Give the report a title. It should be unique within its home app. Supported characters for search names are a-z, A-Z, 0-9, or _.
To avoid confusion with federated search syntax, do not give reports titles that begin with federated:.
- (Optional) Provide a report description.
- Provide the search string.
- (Optional) Provide Earliest time and Latest time values for the search. Use relative time modifiers.
If you want the search to run over all time, leave Start time and Finish time blank. - Select the home App for the report if the default is incorrect. This setting defaults to your current app context.
- (Optional) Add a time range picker to the report. A time range picker allows users without write permissions to rerun the report over a different time range without actually editing it.
If you do not provide a time range picker, the report always runs over the same time range as the original search. To change the time range, a user with edit permissions for the report must open it in Search, update its time range, and save that edit.
The time range picker option is unavailable for scheduled reports, which always display the results returned by their last scheduled run. If you schedule a report that has a time range picker, the time range picker disappears. - Click Save to create the report. It will display on the Reports listing page and the Searches, reports, and alerts page in Settings.
You can edit and update searches listed on the Searches, Reports and Alerts page if you have "write" permissions for them. See Manage knowledge object permissions in the Knowledge Manager Manual.
Preview your saved search
You can preview a search before running it by using search expansion. Search expansion allows you to preview your search by expanding the entire search, including saved searches, without running the search.
Prerequisites
- Create a report. See Create a new report in Settings.
Steps
- Navigate to the Splunk Search page.
- In the Search bar, type the default report
Errors in the last 24 hours. - Open search expansion by using the keyboard shortcut Command-Shift-E (Mac OSX) or Control-Shift-E (Linux or Windows).
The search expansion preview shows syntax highlighting and line numbers, if those features are turned on. - (Optional) Copy a fragment of the search.
- (Optional) Run your search by clicking Open in Search.
A window opens with your expanded search.
Convert a dashboard panel inline search to a report
If you work with Splunk dashboards, you may know that the dashboard panels can be "powered" by inline searches or reports. There are advantages to both panel types.
| Panel type | Creation methods | Advantages of |
|---|---|---|
| Backed by inline search (search string in panel definition) |
|
You can edit the search that backs the panel without leaving the dashboard editor. |
| Backed by report |
|
|
You can easily convert the inline search in a dashboard panel definition to a report, thus converting the panel to a report-backed panel. When you do this, the new report is added to the Reports listing page and the Searches, Reports, and Alerts page in Settings. You can also define acceleration, scheduling, and permissions settings for the report that powers the panel.
For more information about how dashboard panels are created and how they end up with inline searches, see Add reports and saved searches from the Reports tab in the Dashboard Studio manual.
Dashboard panels based on reports can have different formatting than the reports they're associated with. See "Have a dashboard panel take on the formatting of its affiliated report," in this topic.
To convert a dashboard panel to a report
1. Locate the dashboard that you want to convert and click Edit.
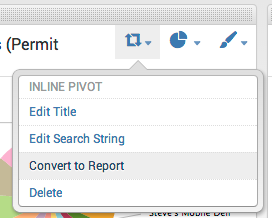
- Icons appear at the upper right corner of each panel in the dashboard.
2. Click the Panel Properties icon for a panel based on a search or pivot and select Convert to Report.
- The Panel Properties icon is the leftmost of the three panel editing icons mentioned in the previous step. Its icon indicates the panel's document type--a magnifying glass for a panel based on a search, pivoting arrows for a pivot, or a sheet of paper for a search- or pivot-based report.
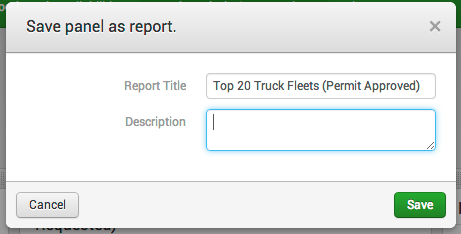
- The Save panel as report dialog appears.
3. (Optional) Provide a different Title and Description for the report than the title and description associated with the panel.
4. Click Save.
- Splunk software adds the new report to the Reports listing page.
Have a dashboard panel take on the formatting of its affiliated report
If you convert a dashboard panel to a report and then edit the report so it uses a different visualization or has different visualization formatting, your changes will not automatically be reflected in the affiliated panel. To sync up the dashboard panel with the updated report, follow these steps:
1. Click Edit for the dashboard that contains the panel you'd like to update.
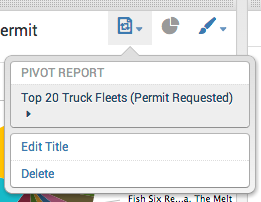
2. Click the Panel Properties icon for the panel you'd like to update.
3. Select the panel/report name (the name only appears for panels that have already been converted to a report).
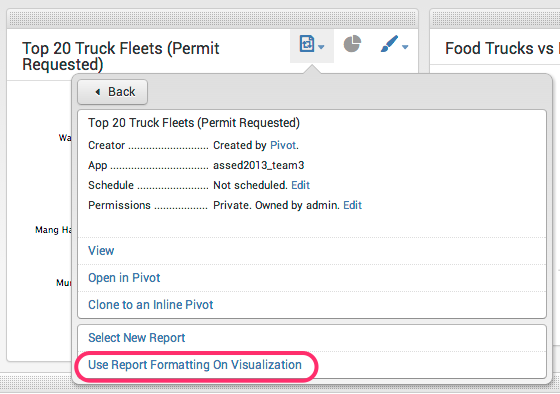
- A report info screen appears. Here you can edit various aspects of the report (permissions, acceleration, scheduling, and so on) if your permissions enable you to do so.
4. Click Use Report Formatting on Visualization and confirm that you want the panel to use the report's formatting.
- This causes the panel to use the visualization type and formatting that you have defined for the report. For example, if the panel displays a pie chart, but the report associated with the panel is configured to display its data as a column chart, click Use Report Formatting on Visualization. This makes the panel display the data in the form of a column chart.
- In a similar manner, you can make the panel use the data and formatting of an entirely different report. Follow the steps above but click Select New Report instead of Use Report Formatting on Visualization. This opens the Select a New Report dialog. Choose a different report, click save, and the panel updates to display data visualized according to the selected report.
Note: If the inline dashboard panel derives from a pivot, you lose the ability to change the panel visualization type via the dashboard when you convert it to a report.
Your permissions determine what reports you can choose and edit.
Edit a report
You can easily edit an existing report. You can edit a report's definition (its search string, pivot setup, or result formatting). You can also edit its description, permissions, schedule, and acceleration settings.
To edit a report's definition
If you want to edit a report's definition, there are two ways to start, depending on whether you're on the Reports listing page or looking at the report itself.
- If you're on the Reports listing page, locate the report you want to edit, go to the Actions column, and click Open in Search or Open in Pivot (you'll see one or the other depending on which tool you used to create the report).
- If you've entered the report to review its results, click Edit and select Open in Search or Open in Pivot (you'll see one or the other depending on which tool you used to create the report).
Edit the definition of a report opened in Search
After you open a report in search, you can change the search string, time range, or report formatting. After you rerun the report, a Save button will be enabled towards the upper right of the report. Click this to save the report. You also have the option of saving your edited search as a new report.
Edit the definition of a report opened in Pivot
After you open a report in Pivot, change the definition of the pivot as you would like. You can add, remove, or redefine filters, split rows, split columns, or column values. You can also change the way the pivot results are formatted (change the visualization type, or fix the way a chart displays). When you are done, click Save at the upper right of the page to save your report. You also have the option of saving your edited pivot as a new report.
To edit a report's description, permissions, schedule, and acceleration settings
You can do this from the Reports listing page, or from the report viewing page. Click Edit and choose:
- Edit Description to change the name and description of the report.
- Edit Permissions to change the report permissions. See Set report permissions, in this manual.
- Edit Schedule to schedule the report or change the report schedule if it already has one. See Schedule reports, in this manual.
- Edit Acceleration to change the way the report is accelerated. Note: This option is only available for certain kinds of reports created in Search. See Accelerate reports, in this manual.
Note: You can't perform these actions if you've opened the report in Search or Pivot. Save the report or return to the Reports listing page if you want to edit these aspects of the report.
Use the Advanced Edit page to update a report configuration
If your role enables it, you can edit the full configuration of a report with the Advanced Edit page. The Advanced Edit page exposes a large variety of configuration settings for reports.
The Advanced Edit page does not provide lists of options for settings, nor does it validate the values that you do provide. Before changing settings on this page, review savedsearches.conf.spec to learn more about the settings and how they should be filled out.
Prerequisites
- Admin role, power role, or another role with the
schedule_searchcapability. - See the
savedsearches.conf.specfile for documentation of all of the settings on the Advanced Edit page.
Steps
- Select Settings > Searches, Reports, and Alerts.
- Find a report that you want to edit and select Edit > Advanced Edit.
- Update the report configuration as necessary.
- Save your changes.
Clone a report
Report cloning is a way to quickly create a report that is based on an existing report. You can then give the clone a unique name and edit it so it returns different results.
Note: You can't perform this action if you've opened the report in Search or Pivot. Save the report or return to the Reports listing page if you want to clone it.
Caution: Do not give your cloned report the same name and search string as the original report. If you do this, you create a situation where the original report and the cloned report are linked together. This means that the original report must exist in order for its clone to exist. If you delete the original report, the linked clone report disappears with it.
If you keep your clone private, you might give it the same name as its source report to take advantage of this link. When a user updates the original report, Splunk software updates the linked private customized clone as well.
1. Open the Reports listing page.
2. Locate a report that you want to clone and click its Edit link.
3. From the list that appears, select Clone.
- The Clone window appears.
4. For New Title, provide a unique name for the cloned report.
- Splunk software gives the cloned report the name of the original report plus the word "Clone." We recommend that you give the cloned report a unique name, especially if you plan to share it with other users.
5. (Optional) Give the cloned report a Description and set its Permissions.
- Leave the Permissions set to Private if you do not want to share the cloned report with anyone else. Select Clone if you want the cloned report to have the same permissions as the original report.
6. Click Clone report to clone the report. The cloned report now appears on the Reports listing page.
Disable a report
If your permissions allow it, you can disable a report. When a report is disabled, it continues to appear in the Report listings page and in Searches, Reports, and Alerts, but it cannot be run.
You typically use this feature to disable scheduled reports. This means they cease to run on their schedule, but still exist in the system with their schedule definitions intact. You can enable a disabled scheduled report when you want it to run on its schedule again.
- Navigate to Settings > Searches, Reports, and Alerts.
- Locate the search you want to disable and click its Disable link.
If you try to run a disabled report you will see an error message. If your permissions allow it, the message includes an Enable Report button that you can use to enable the disabled report and an Open in Search button that you can use to run the search string used by the report.
Delete a report
You can delete a report from the Reports listing page or the report viewing page. Just click Edit and select Delete. Most roles can only delete reports that they have created. For more information about granting roles the ability to delete reports that they do not own, see Disable or delete knowledge objects, in the Knowledge Manager Manual.
Note: You can't perform this action if you've opened the report in Search or Pivot. Save the report or return to the Reports listing page if you want to edit these aspects of the report.
Configure a report in savedsearches.conf (Splunk Enterprise)
When you save a report via Splunk Web or Settings, Splunk software automatically adds a configuration stanza for that report to savedsearches.conf. The UI validates your changes, and you don't have to reboot the system to apply reports created via UI methods. But if you have Splunk Enterprise and prefer to work with reports directly through configuration files, you certainly can.
For more information about configuring reports and alerts in savedsearches.conf, see the spec file for savedsearches.conf and the Configure alerts in savedsearches.conf topic in the Alerting Manual.
Answers
Have questions? Visit Splunk Answers and see what questions and answers the Splunk community has around reports.
| About reports | Set report permissions |
This documentation applies to the following versions of Splunk Cloud Platform™: 9.1.2308, 9.2.2403, 9.2.2406, 9.3.2408 (latest FedRAMP release), 9.3.2411


 Download manual
Feedback submitted, thanks!