Basic searches and search results
In this section, you create searches that retrieve events from the index.
The data for this tutorial is for the Buttercup Games online store. The store sells games and other related items, such as t-shirts. In this tutorial, you will primarily search the Apache web access logs, and correlate the access logs with the vendor sales logs.
Prerequisite
Complete the steps, Upload the tutorial data, in Part 2.
Using the Search Assistant
The Search Assistant is a feature in the Search app that appears as you type your search criteria. The Search Assistant is like autocomplete, but so much more.
- Click Search in the App bar to start a new search.
- Type
buttercupin the Search bar.
When you type a few letters into the Search bar, the Search Assistant shows you terms in your data that match the letters that you type in. - Click Search in the App bar to start a new search.
- Type
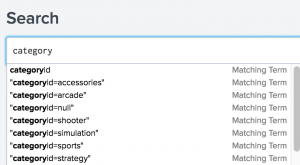
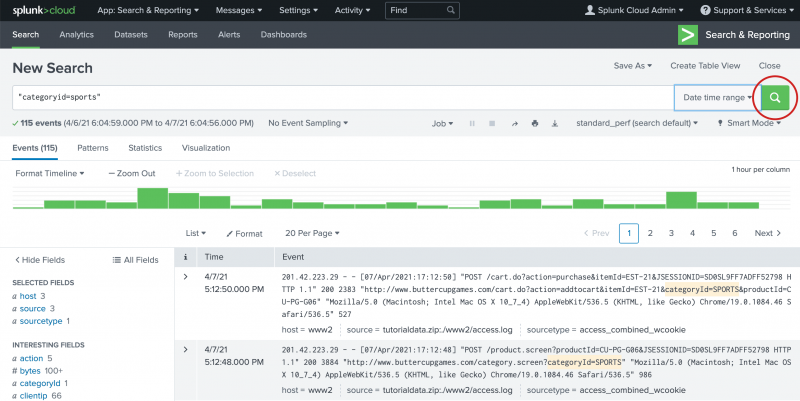
categoryin the Search bar. The terms that you see are in the tutorial data. - Select "categoryid=sports" from the Search Assistant list.
- Press Enter, or click the Search icon on the right side of the Search bar, to run the search.
Matching Searches
The Search Assistant also returns matching searches, which are based on the searches that you have recently run. The Matching Searches list is useful when you want to run the same search from yesterday, or a week ago. Your search history is retained when you log out.
The Search Assistant is more useful after you start learning the search language. When you type search commands, the Search Assistant displays command information.
Retrieve events from the index
Let's try to find out how many errors have occurred on the Buttercup Games website.
To retrieve events that mention errors or failures, you type the keywords in your search criteria. If you use multiple keywords, you must specify Boolean operators such as AND, OR, and NOT.
The AND operator is implied when you type in multiple keywords.
For example, typing buttercupgames error is the same as typing buttercupgames AND error.
- Start a new search.
- Change the time range to All time.
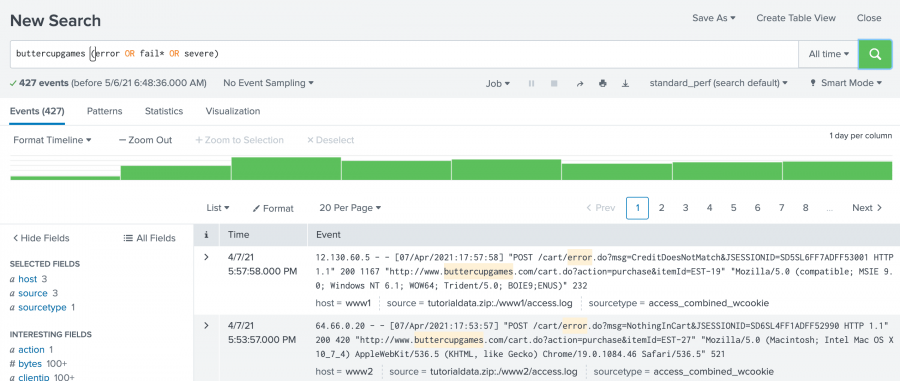
- To search for the terms error, fail, failure, failed, or severe, in the events that also mention buttercupgames, run the following search.
buttercupgames (error OR fail* OR severe)Tip: Instead of typing the search string, you can copy and paste the search from this tutorial directly into the Search bar.
- Click the Search icon to the right of the time range picker to run the search.
Notice that you must capitalize Boolean operators. The asterisk ( * ) character is used as a wildcard character to match fail, failure, failed, failing, and so forth.
When evaluating Boolean expressions, precedence is given to terms inside parentheses. NOT clauses are evaluated before OR clauses. AND clauses have the lowest precedence.
This search retrieves 427 matching events.
Understanding search results
Below the Search bar are four tabs: Events, Patterns, Statistics, and Visualization.
The type of search commands that you use determines which tab the search results appear on. In the early parts of this tutorial, you will work with the Events tab. Later in this tutorial, you will learn about the other tabs.
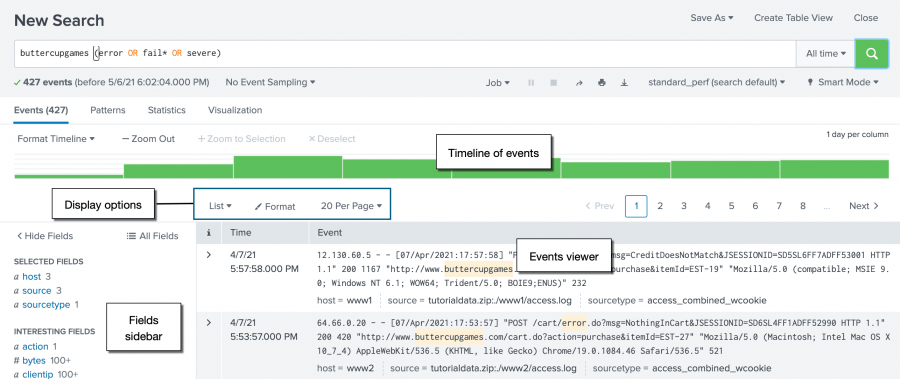
The Events tab displays the Timeline of events, the Display options, the Fields sidebar, and the Events viewer.
By default, the events appear as a list that is ordered starting with the most recent event. In each event, the matching search terms are highlighted. The List display option shows the event information in three columns.
| Column | Description |
|---|---|
| i | Use the event information column to expand or collapse the display of the event information. By default the display is collapsed. Click the greater than ( > ) symbol to expand the display. |
| Time | The timestamp for the event. When events are indexed, the timestamp in the event is extracted. If the event does not contain a timestamp, the indexing process adds a timestamp that is the date and time the event was indexed. |
| Event | The raw event data. The Selected fields from the Fields sidebar appear at the bottom of each event. |
Change the display of the Events viewer
- Select the List option and click Table.
The display changes to show the event information column, the timestamp column, and columns for each of the Selected fields. You will learn more about the Selected fields later in the tutorial. - Change the display back to List.
Timeline of events
The Timeline of events is a visual representation of the number of events that occur at each point in time. As the timeline updates with your search results, there are clusters or patterns of bars. The height of each bar indicates the count of events. Peaks or valleys in the timeline can indicate spikes in activity or server downtime. The timeline highlights patterns of events, or peaks and lows in event activity. The timeline options are located above the timeline. You can zoom in, zoom out, and change the scale of the timeline chart.
Fields sidebar
When you add data to the Splunk platform the data is indexed. As part of the index process, information is extracted from your data and formatted as name and value pairs, called fields. When you run a search, the fields are identified and listed in the Fields sidebar next to your search results. The fields are divided into two categories.
- Selected fields are visible in your search results. By default, host, source, and sourcetype appear. You can select other fields to show in your events.
- Interesting fields are other fields that have been extracted from the events in your search results.
You can hide the fields sidebar to maximize the results area.
Patterns, Statistics, and Visualizations
The Patterns tab displays a list of the most common patterns among the set of events returned by your search. Each of these patterns represents events that share a similar structure.
The Statistics tab populates when you run a search with transforming commands such as stats, top, chart, and so on. The keyword search for "buttercupgames" does not show results in this tab because the search does not include any transforming commands.
Searches with transforming commands also populate the Visualization tab. The results area of the Visualizations tab includes a chart and the statistics table that is used to generate the chart.
You will learn about transforming commands, and use the Statistics and Visualizations tabs, later in the tutorial.
Next step
Learn to use fields to search your data.
See also
- Help building searches using the Search Assistant in the Search Manual
- Identify event patterns with the Patterns tab in the Search Manual
- Introduction to Pivot in the Pivot Manual
| Specifying time ranges | Use fields to search |
This documentation applies to the following versions of Splunk Cloud Platform™: 9.3.2411, 8.2.2112, 8.2.2201, 8.2.2202, 8.2.2203, 9.0.2208, 9.0.2205, 9.0.2209, 9.0.2303, 9.0.2305, 9.1.2308, 9.1.2312, 9.2.2403, 9.2.2406, 9.3.2408 (latest FedRAMP release)


 Download manual
Feedback submitted, thanks!