Send Splunk UBA anomalies and threats to Splunk ES as notable events
You can send anomalies and threats identified in Splunk User Behavior Analytics (UBA) to Splunk Enterprise Security (ES) as notable events.
For Splunk UBA version 5.4.0 and higher, the Splunk ES account being used for UBA-ES integration must have the edit_http_token capability.
The following image summarizes the steps you must take to send anomalies and threats from Splunk UBA to Splunk ES as notable events.

The Splunk Add-on for Splunk UBA is installed by default with Splunk ES and consists of two separate add-ons: SA-UEBA and the Splunk Add-on for UEBA.
Complete the following steps:
- Verify that the Splunk Add-on for UEBA is installed and enabled.
- Enable SA-UEBA so that Splunk ES can retrieve data from Splunk UBA.
- Configure the Splunk platform to receive data from the Splunk UBA output connector.
- Add an output connector in Splunk UBA.
- (Optional) Learn How threats and notables are synchronized.
Verify that the Splunk Add-on for UEBA is installed and enabled
Perform the following steps to verify that the Splunk Add-on for UEBA is installed.
- Log in to the Splunk search head with Splunk Enterprise Security installed.
- In Splunk Web, select Apps > Manage Apps.
- Search for ueba and verify that Splunk_TA_ueba is installed and enabled.
- If the add-on is not enabled, click Enable to enable it.
Enable SA-UEBA so that Splunk ES can retrieve data from Splunk UBA
Enable SA-UEBA so that dashboards and knowledge objects are visible to users in Splunk Enterprise Security. This task is required to retrieve data from Splunk UBA to display on the Session Center dashboard in Splunk Enterprise Security, to model data sent from Splunk UBA with the UEBA data model, and to use correlation searches to analyze threats and anomalies sent from Splunk UBA.
- Log in to the Splunk search head with Splunk Enterprise Security installed.
- In Splunk Web, select Apps > Manage Apps.
- Locate the SA-UEBA add-on.
- Click Enable to enable the add-on.
Configure the Splunk platform to receive data from the Splunk UBA output connector
Send Splunk UBA audit events to Splunk ES by setting up an output connector. Sending UBA audit events to Splunk ES uses the same process as sending UBA anomalies and threats. It is not required to select Process Threats or Process Anomalies to send UBA audit events to Splunk ES.
Splunk UBA audit events can only be sent to the same Splunk ES deployment that Splunk UBA is sending anomalies and threats to. After following all the steps and configuring the output connector in Splunk UBA, Splunk UBA can forward UBA audit events to the specified Splunk ES deployment.
Steps on the Splunk Enterprise search head
Perform the following steps on the Splunk Enterprise search head. In a search head clustering environment, perform the changes on the search head that will receive the Splunk UBA threats and anomalies.
If you are using the default certificate provided with the Splunk Platform, copy the root CA certificate from /opt/splunk/etc/auth/cacert.pem on the Splunk Enterprise instance to /home/caspida on the Splunk UBA management server.
If you use your own third-party certificate, copy that certificate file to /home/caspida on the Splunk UBA management server. Do not copy the root CA certificate from /opt/splunk/etc/auth/cacert.pem on the Splunk Enterprise instance.
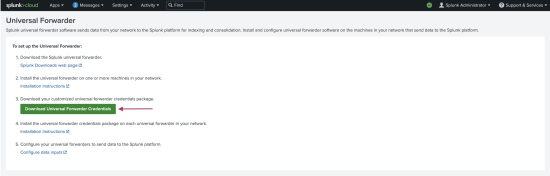
If you are on Splunk Cloud, you must have the Splunk Universal Forwarder app installed.
- Go to the Splunk Universal Forwarder app home page.
- Select Download Universal Forwarder Credentials to get the
splunkclouduf.splUniversal Forwarder App file, as shown in the following image:
- Untar the app and copy the
*.pemfilefrom the./defaultdirectoryof the app to/home/caspidaon the Splunk UBA management server.Splunk Cloud issues new TLS certificates for Splunk Cloud deployments periodically. Step 3 must be repeated every time a new TLS certificate is issued.
- Add
connection_host = ipto the HTTP Event Collector (HEC)inputs.confon the ES search head.
For example:This ensures that the host field remains as the sender's (UBA) IP address instead of the default HEC host and port./opt/splunk/etc/apps/splunk_httpinput/local/inputs.conf
- The Splunk ES account being used for UBA-ES integration must have the
edit_http_tokencapability. - Port
8088must be open on the Splunk ES search head.

Splunk HTTP Event Collector setup
The Splunk HTTP Event Collector must be set up to send data from Splunk UBA to the Splunk Platform. See Set up and use HTTP Event Collector in Splunk Web in the Splunk Cloud Platform manual.
For Splunk Cloud users, Splunk UBA does not programmatically set up a HTTP Event Collector token. Use the Admin Config Service to set up a token. For steps, see Manage HTTP Event Collector (HEC) tokens in Splunk Cloud Platform in the Splunk Cloud Platform manual.
Refer to the following table for field name guidance:
| Field name | Value to enter |
|---|---|
name |
SplunkES-UBA-Integration.v1
|
defaultSourcetype |
ueba
|
allowedIndexes |
ueba and risk
|
Create the new HTTP Event Collector token, and copy down the value of the token.
Splunk Cloud users also need to note the values for host and port which are used for the HTTP Event Collector and are unique to each Splunk Cloud deployment.
Steps on the Splunk UBA management server
Perform the following steps on the Splunk UBA management server:
- Log in to the Splunk UBA management server as the caspida user.
- Ensure that
$JAVA_HOMEis set correctly on your system. Run theCaspidaCommonEnv.shscript to set this environment variable:. /opt/caspida/bin/CaspidaCommonEnv.sh
- Import the rootCA certificate to the Java certificate store.
If you use your own third party certificate, replace
~/cacert.pemwith that third party certificate with the following commands. If you are on Splunk Cloud replace~/cacert.pemwiththe*.pemfileprovided from the Splunk Universal Forwarder app.On RHEL or OEL systems, use the following command:
sudo keytool -import -alias "splunk es" -keystore $JAVA_HOME/lib/security/cacerts -file ~/cacert.pem
On Ubuntu systems, use the following command:
sudo keytool -import -alias "splunk es" -keystore $JAVA_HOME/jre/lib/security/cacerts -file ~/cacert.pem
For Splunk Cloud users, use the
*.pemfile copied previously from the Splunk Universal Forwarder in the Splunk Enterprise search head step.Splunk Cloud users must repeat this step each time a new TLS certificate is issue for their Splunk Cloud deployment.
- When prompted, enter the keystore password and trust the certificate. The default keystore password is
changeit. - From the command line of the Splunk UBA management server, view the
/etc/caspida/local/conf/uba-site.propertiesfile to confirm the following parameters are set to "true" as shown:
uba.splunkes.integration.enabled=trueconnectors.output.splunkes.ssl=true
- Customers with existing UBA-ES integrations must comment out or remove the previously configured
[tcp-ssl:10008]stanza from theSplunk_TA_uebainputs.conf on the Splunk ES search head to avoid having an unused listener. - If you are a Splunk Cloud user with custom configurations on your HTTP Event Collector, complete this step. Otherwise skip to step 8.
From the command line of the Splunk UBA management server, open/etc/caspida/local/conf/uba-site.properties.- Add the following properties:
splunkes.hec.token.value = <token value of the HTTP Event Collector token>
splunkes.hec.host = <HTTP Event Collector host URI>
splunkes.hec.port = <HTTP Event Collector port>
- If you set the name of the HTTP Event Collector token to a value other than
SplunkES-UBA-Integration.v1, set thesplunkes.hec.token.keyfield to that name.
- Add the following properties:
- Restart Splunk UBA. Run the following commands on the Splunk UBA management server:
/opt/caspida/bin/Caspida stop-all
/opt/caspida/bin/Caspida start-all
Add an output connector in Splunk UBA
Set up Splunk UBA to send data to the Splunk search head or a Splunk forwarder. Splunk UBA uses the output connector to send anomalies and threats to Splunk Enterprise Security.
- Make sure the Splunk Add-on for Splunk UBA is properly deployed and enabled. See Deploy the Splunk Add-on for Splunk UBA.
- Make sure the SA-UEBA add-on is enabled. See Enable SA-UEBA so that Splunk ES can retrieve data from Splunk UBA.
- Log in to Splunk UBA as an admin user.
- Select Manage > Output Connectors.
- Click New Output Connector.
- Select an output connector of SplunkES and click Next.
- Type a Name for the output connector.
- Specify the Splunk ES API URL in the following format:
https://<forwarder-host>:<mgmt-port>
Splunk UBA uses this connection to synchronize the status of its threats with notable events in Splunk ES. The management port is usually 8089.
- Specify a username and password. See Splunk Enterprise and Splunk ES requirements for the requirements of this user account.
- Select how you want this output connector to process anomalies and threats.
Option Description Process Threats Select Process Threats to enable Splunk UBA to export threats based on any configured output connectors, such as sending email or sending threats to Splunk ES. If this is not selected, no threats are exported from Splunk UBA, even if Auto Process is selected. Process Anomalies Select Process Anomalies to enable Splunk UBA to export anomalies based on any configured output connectors, such as sending email or sending anomalies to Splunk ES. If this is not selected, no anomalies are exported from Splunk UBA, even if Auto Process is selected. Auto Process Select Auto Process to automatically forward anomalies and threats as they are created to Splunk ES. If this is not selected, you must forward each threat and corresponding anomalies during threat review with the Export to Splunk ES action from the Threat Details page. See Review Current Threats in Use Splunk User Behavior Analytics.
Selecting Auto Process in conjunction with Process Anomalies can cause a significant increase in traffic. Review the output connector logs to verify the health and performance of your system. See the Output Connector Service health monitor status codes. If you are monitoring Splunk UBA using the Splunk UBA Monitoring app, see About the Splunk UBA Monitoring app in theSplunk UBA Monitoring App manual.
Send risk events and turn off UBA Correlation Searches in ES Leverage Splunk Enterprise Security Risk Based Alerting (RBA) by creating and sending risk events for UBA anomalies and threats directly from Splunk UBA to Splunk ES. - If Process Threats is selected, risk events for threats are created and sent over.
- Likewise if Process Anomalies is selected, risk events for anomalies are created and sent over.
The field
uba.splunkes.integration.enabledin theuba-default.propertiesis set as true by default and must remain as true for RBA to work.Choosing to send risk events and turn off UBA Correlation Searches in ES, also turns off the correlation searches that correspond to UBA threats and anomalies in Splunk ES. This is turned off to avoid duplicates. Deselecting the send risk events option will turn these correlation searches back on .
See How risk-based alerting works in Splunk Enterprise Security in the Splunk Enterprise Security manual. - Click OK to save the new output connector.
If the output connector does not work, verify that you configured the host server correctly in the uba-site.properties file. The host identified in the file populates the host field for events sent to Splunk Enterprise Security or the Splunk platform.
See Connect Splunk UBA to Splunk Enterprise to view an anomaly's raw events in the Install and Upgrade Splunk User Behavior Analytics manual.
How threats and notable events are synchronized
Once the output connector is configured, Splunk UBA attempts to send threats to Splunk ES every 5 minutes with no limits on the number of retries. Any issues with the connection mean that new threats are not sent to Splunk ES until the connection issues are resolved. Any connection issues between the output connector and Splunk ES also affect other output connectors that are configured, such as email and ServiceNow. If the connection issues persist for more than one hour, alerts are generated in the health monitor in Splunk UBA. See Monitor the health of your Splunk UBA deployment in Administer Splunk User Behavior Analytics.
Perform the following steps to change the retry interval:
- On the Splunk UBA management node, log in as the caspida user.
- Edit the
/etc/caspida/local/conf/uba-site.propertiesfile and modify theuba.splunkes.retry.delay.minutesproperty. For example, to set the retry interval to 3 minutes:uba.splunkes.retry.delay.minutes = 3
- In distributed deployments, synchronize the cluster:
/opt/caspida/bin/Caspida sync-cluster /etc/caspida/local/conf
Work with Splunk UBA threats as notable events in Splunk ES
When Splunk UBA and Splunk ES are integrated using an output connector, Splunk UBA creates a new custom status on Splunk ES called Closed in Uba as shown in the following image.

The status of threats in Splunk UBA and their corresponding notable events in Splunk ES are synchronized.
What happens when a threat is closed in Splunk UBA
Threats in Splunk UBA can be closed by the user or closed by the system:
- Threats in Splunk UBA are considered closed by the user if a user clicks Not a Threat in Splunk UBA.
- In all other cases, the threat in Splunk UBA is considered to be closed by the system.
When a threat is closed in Splunk UBA, Splunk UBA checks the status of the corresponding notable event in Splunk ES. If the notable event is not already closed in Splunk ES, Splunk UBA closes the notable event by setting the end status to Closed in Uba.
If the notable event is reopened in Splunk ES, a threat closed by the user in Splunk UBA is reopened. A threat closed by the system remains closed in Splunk UBA. The threat can still be viewed, but no action can be taken on the threat. This workflow is illustrated in the following diagram:

What happens when a threat is reopened in Splunk UBA
A threat in Splunk UBA can be reopened in the following cases:
- Threat computation causes a threat to be reopened.
- An anomaly action rule affects anomalies that cause a threat to be reopened.
- A threat rule is modified, causing a threat to be reopened.
When a threat is reopened, Splunk UBA checks to see if the notable event in Splunk ES has an end status of ClosedInUba and if yes, the notable event is also reopened.
No action is taken if the notable event is already open in Splunk ES, or if it has an end status other than ClosedInUba.
Splunk UBA queries for the status of notable events in Splunk ES
Splunk UBA queries Splunk ES in 5-minute intervals to synchronize the status of threats in Splunk UBA and notable events in Splunk ES.
When the query detects that a notable event is closed, Splunk UBA checks to see if the corresponding threat is also closed. If not, the threat is closed with a status of ClosedbyUser as shown in the following diagram:

When the query detects that a notable event is not closed, Splunk UBA checks to see if the corresponding threat has a status of ClosedbyUser. If so, the threat is reopened with a status of Active as shown in the following diagram:

What happens if the output connector is unable to send threats to Splunk ES?
If the output connector is unable to send threats to Splunk ES, due to a network issue or Splunk ES being temporarily unavailable, the output connector makes another attempt every 5 minutes. After 1 hour, if the connection is not resolved, the output connector raises an error in the health monitor. See OCS-11 in Administer Splunk User Behavior Analytics.
|
PREVIOUS Integrate Splunk ES and Splunk UBA with the Splunk Add-on for Splunk UBA |
NEXT Pull notable events from Splunk Enterprise Security to Splunk UBA |
This documentation applies to the following versions of Splunk® User Behavior Analytics: 5.4.0
Feedback submitted, thanks!