 Download topic as PDF
Example: Troubleshoot an output connector
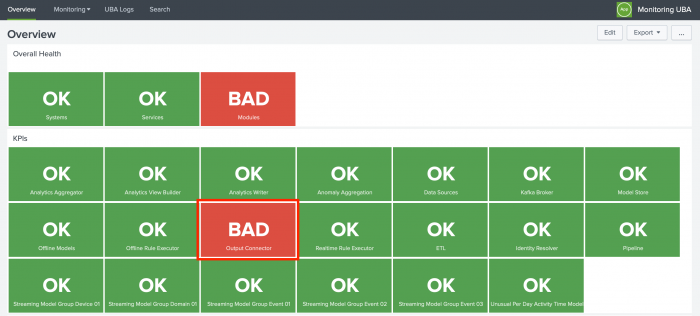
The following example examines a BAD status on the Output Connector indicator.
The BAD status means something has stopped working. Select the BAD status to open the KPIs page.
Examine the KPIs for the output connector
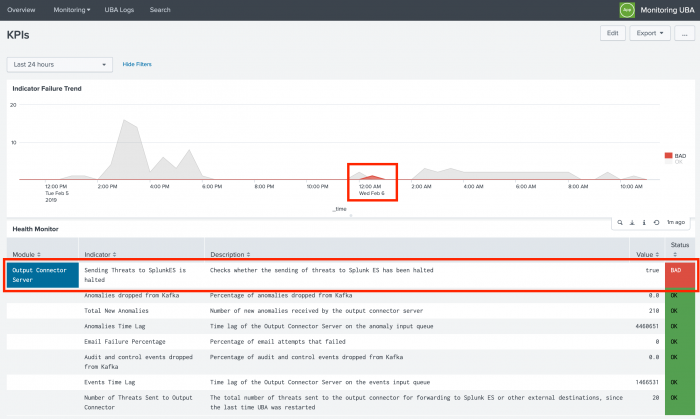
On the KPIs screen, you can highlight the BAD status in the Indicator Failure Trend and see that the event occurred between Midnight and 1:00 AM on February 6. The Health Monitor section of the page shows additional information that Splunk UBA was not able to send threat to Splunk Enterprise Security (ES).
You can examine the Splunk UBA logs for further information. Select UBA Logs in the menu bar.
Examine the Splunk UBA logs
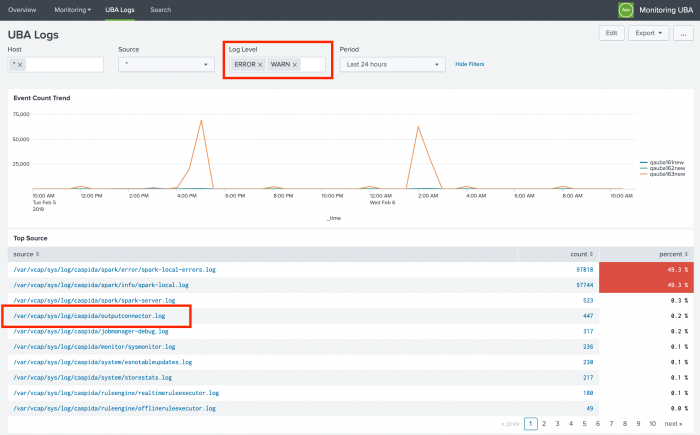
By default, error level messages are shown on the UBA Logs page. Add WARN to the Log Level filter at the top of the page. The outputconnector.log appears as one of the top 10 logs generating events in the system.
Select outputconnector.log to view more information.
Examine events in the log
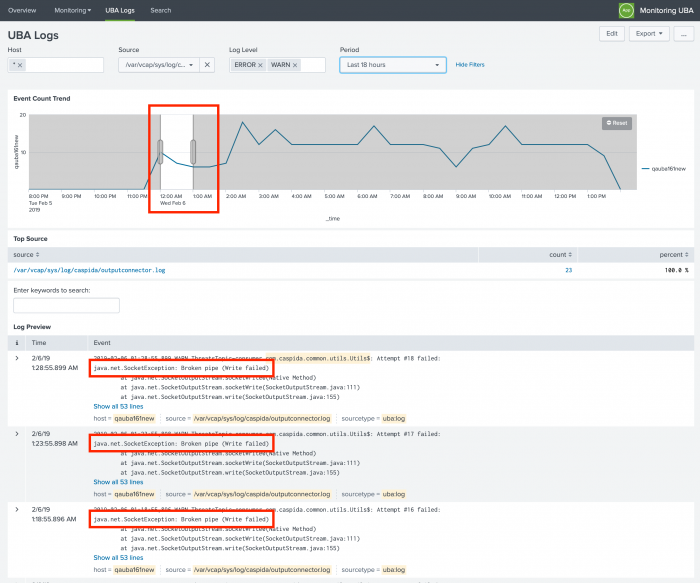
You can change the time range in the Event Count Trend to narrow down the number of events you examine. Earlier in the example, issues were identified between Midnight - 1:00 AM. Adjust the slider in the Event Count Trend to include only events between Midnight - 1:00 AM on February 6.
You see many Broken pipe warning messages, indicating a problem with the connection in the output connector.
In this situation, you can consider the following actions:
- Check your Splunk ES instance to make sure that it is still running.
- Verify your network settings to make sure that Splunk UBA can reach your Splunk ES instance.
|
PREVIOUS Example: Troubleshoot a data source |
NEXT Example: CPU usage spike |
This documentation applies to the following versions of Splunk® User Behavior Analytics Monitoring App: 1.1.4


Feedback submitted, thanks!