Get your data for the Splunk App for AWS
Work with the dashboards
Use the dashboards provided by the Splunk App for AWS to access and analyze your data.
See "Overview of the dashboards in the Splunk App for AWS" for an introduction to the dashboards and some tips for troubleshooting if you do not see your data.
Work with alerts
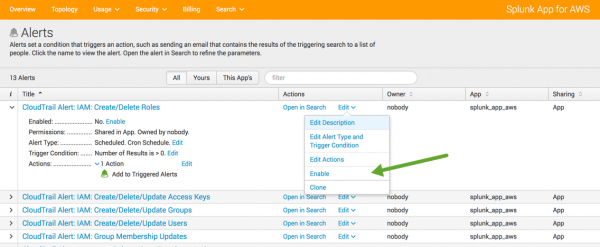
The Splunk App for AWS includes thirteen preconfigured alerts that can be used to monitor CloudTrail events.
Use them as templates to build your own alerts, or simply enable them. For example, if you would like to get a notification when an IAM role is deleted, enable CloudTrail Alert: IAM: Create/Delete Roles.
Access reports
The Splunk App for AWS includes two reports based on saved searches that are enabled by default when you start collecting data with this app.
- CloudTrail EventName Generator is used to extract the eventname from CloudTrail for use in the
aws-action-status-lookup.csv, which supports CIM-compliance for theactionandstatusfields. - Config: Topology Data Generator is used to generate data for the Topology dashboard.
In most cases, you do not need to run these reports manually. Both of them are scheduled to run every twenty minutes on the hour, twenty minutes past the hour, and forty minutes past the hour. If you want to refresh the data sooner, you can run them manually. However, AWS does not deliver CloudTrail or Config data in real time, so you may experience a one to two hour delay before it arrives in your S3 bucket regardless of when you last ran these reports.
Search
As with any data source, you can search the raw data in the Splunk platform. For a full list of source types to use in your searches, see "What data the Splunk App for AWS collects" in the Installation and Configuration manual.
| Log in and get started with the Splunk App for AWS | Overview of the dashboards in the Splunk App for AWS |
This documentation applies to the following versions of Splunk® App for AWS (EOL): 4.0.0

 Download manual
Feedback submitted, thanks!