Configure JMX inputs for the Splunk Add-on for IBM WebSphere Application Server
The Splunk Add-on for IBM WebSphere Application Server relies on the Splunk Add-on for Java Management Extensions (JMX) to collect JMX metrics. The Splunk Add-on for IBM WAS provides a jmx_templates.conf that the Splunk Add-on for JMX can invoke.
Note: To collect JMX data from an IBM WebSphere application server, you need to install the IBM JDK or JRE, which you can download here. Put the JDK or JRE bin directory in the system path to make sure that the JMX data collection uses this IBM version of the Java runtime.
1. Install the Splunk Add-on for JMX on the Splunk Enterprise instance responsible for JMX data collection, usually a heavy forwarder. This add-on can collect JMX metrics locally or remotely.
2. Go to your WebSphere installation directory and navigate to $WAS_ROOT/WebSphere/AppServer/runtimes.
3. Copy these three files to $SPLUNK_HOME/etc/apps/Splunk_TA_jmx/bin/lib:
com.ibm.ws.admin.client_*.jarcom.ibm.ws.ejb.thinclient_*.jarcom.ibm.ws.orb_*.jar
4. After copying, verify the files successfully copied to your $SPLUNK_HOME/etc/apps/Splunk_TA_jmx/bin/lib directory before continuing. For example, if you run the command ls /opt/splunk/etc/apps/Splunk_TA_jmx/bin/lib/com.ibm*, you should see something similar to:
   /opt/splunk/etc/apps/Splunk_TA_jmx/bin/lib/com.ibm.ws.admin.client_8.5.0.jar
   /opt/splunk/etc/apps/Splunk_TA_jmx/bin/lib/com.ibm.ws.ejb.thinclient_8.5.0.jar
   /opt/splunk/etc/apps/Splunk_TA_jmx/bin/lib/com.ibm.ws.orb_8.5.0.jar
5. Restart the Splunk platform.
6. Go to Splunk Web and access the configuration pages for the Splunk Add-on for JMX, either by clicking on the name in the left nav, or going to Apps > Manage Apps, then clicking Launch app in the row for Splunk Add-on for JMX.
7. Click Add Server to add a new JMX server.
8. Enter a Name and an optional JVM Description for your server.
9. For Connection Type, choose Use URL directly from the dropdown menu.
10. Enter the URL in this format: service:jmx:iiop://<hostname>/jndi/corbaname:iiop:<hostname>:9100/WsnAdminNameService#JMXConnector.
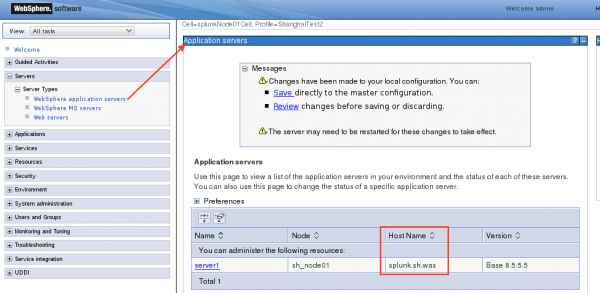
Note: <hostname> is the hostname of the running application server. Use the hostname instead of the IP address. If the hostname cannot be resolved through DNS, add the hostname to the hosts file. You can find the hostname for the application server through WAS administration console.
11. Click Create.
12. Navigate to the task configurations by clicking Configurations > Tasks.
13. Click Add Task to create a new JMX task.
14. Enter a Name and optional Description for your task, then select the server that you just configured.
15. On the Templates tab, select one or more of the predefined templates to collect the data that you want.
16. On the Settings tab, set the source type to ibm:was:jmx.
17. Click Create to enable your JMX input.
For more information about configuring JMX inputs, refer to "Configure inputs for the Splunk Add-on for JMX" in the Splunk Add-on for Java Management Extensions manual.
| Configure IBM WebSphere to produce data for the Splunk Add-on for IBM WebSphere Application Server | Configure global settings, HPEL inputs, and server log inputs for IBM WebSphere Application Server |
This documentation applies to the following versions of Splunk® Supported Add-ons: released

 Download manual
Feedback submitted, thanks!