Troubleshoot the Splunk App for Anomaly Detection
The following are issues you might experience when using the Splunk App for Anomaly Detection and how to resolve them. If you don't see the information you need, you can ask your question and get answers through community support at Splunk Answers.
You see a "Splunk App for Anomaly Detection requires the [PSC/MLTK] add-on to be installed" banner
Cause
You are not running the required version(s) of the Splunk Machine Learning Toolkit (MLTK) app or the Python for Scientific Computing (PSC) add-on.
Solution
Update MLTK or PSC to the required version(s). See, Version dependencies for the Splunk App for Anomaly Detection.
You see an error and are unable to edit values in the Schedule column on the Job Dashboard
Cause
Users need the role capability called schedule_search to be able to add or edit values to the Schedule field on the Job Dashboard.
Solution
If you are a user, ask your Splunk admin to update your role capabilities. Admin users can edit role capabilities under Settings > Roles. See Create and manage roles with Splunk Web in the Securing Splunk Enterprise manual.
In Step 2 "Add the Dataset" seeing a warning
In Step 2 "Add the Dataset", when running the following SPL, you see this warning:
index=wineventlog_security
| timechart count

"Could not load lookup=LOOKUP-HTTP_STATUS No matching fields exist."
Cause
This message might be shown because the search is returning 0 events.
Solution
Confirm whether your original search returns > 0 events by running it in the search bar on the Search tab in Splunk App for Anomaly Detection or in Search & Reporting.
The app is lagging or hanging when you try to add or manage jobs
Cause
You are not running the required version(s) of the Splunk Machine Learning Toolkit (MLTK) app or the Python for Scientific Computing (PSC) add-on.
Solution
Update MLTK or PSC to the required version(s). See, Version dependencies for the Splunk App for Anomaly Detection.
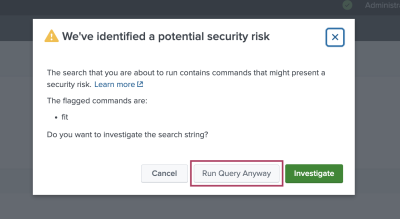
Choosing "Open in Search" under "Step 4: Save & Operationalize Job" displays a security risk modal window
Cause
When you choose to Open in Search' from the job creation step 4 of Save & Operationalize Job, the Splunk UI shows a modal window with the warning message of "We've identified a potential security risk."
Solution
This is expected and stemming from guidelines outside outside of the app itself. You can safely select Run Query Anyway.

For more information on the fit command being deemed as risky, see fit command in the Splunk Machine Learning Toolkit User Guide.
The full dataset doesn't show up in the listed results or on plot
Cause
The app truncates the time series at ten-thousand data points.
Solution
Trim your data to only the most interesting ten-thousand data points, or run the data in batches.
The time range selected in time range picker is not being applied to output of inputlookup
Cause
The time range picker isn't filtering the dataset by date if the dataset is provided using the inputlookup command..
Solution
That is expected behavior as the time range picker does not apply to lookups.
Switch to a search instead, or consider using the head or tail commands:
- For the syntax of the
headcommand, see head in the Search Reference. - For the syntax of the
tailcommand, see tail in the Search Reference.
You can also choose to edit your lookup to only include data from the time range you're interested in analyzing for anomalies.
The Anomalies count to the right of the anomaly plot does not match the number of yellow dots in the plot or number of rows in the anomaly results table
Cause
This is expected behavior. Adjacent anomalous points are counted as a single anomalous interval.
| Support for the Splunk App for Anomaly Detection |
This documentation applies to the following versions of Splunk® App for Anomaly Detection: 1.1.0, 1.1.1, 1.1.2


 Download manual
Feedback submitted, thanks!