Create searches, dashboards, reports
Data models power the new Pivot interface in Splunk Enterprise 6.0 by defining an abstract model of the underlying machine data and meaningful relationships in that data so you can more quickly easily derive insights from machine data. Data models also allow developers to abstract away the search language syntax, making Splunk queries more manageable and portable.
With data models, developers no longer have to embed long, often cryptic query strings in their applications. And since data models have inheritance, the relationships between data models can be programaticaly managed.
Use Pivot to create a report or dashboard
This section walks you through using pivot from a data model to create a search, and then create a simple report or dashboard from that search. You can then save that search as a report or dashboard. This example uses the data model objects in the Authenticate data model.
For more information about using Pivot with data models, see the "Data Model and Pivot Tutorial".
Create a new Pivot from a data model
When you set out to create a pivot from a data model, you first need to select a data model that represents the broad category of event data that you want to use. For this quick example, we will use the "Authentication" data model.
1. From the app navigation bar, select Pivot to go to the Select a Data Model page. When you use Pivot with a data model, you are creating a search for a specific set of data.
2. Double-click the Authentication data model to select the data set to work with. This opens the Select an Object page.
The Authentication data model has a root object called "Privileged Authentication" to identify successful authentications from privileged users. The object has two child objects called "Successful Privileged Authentications" and "Failed Privileged Authentications".
3. Click "Successful Privileged Authentications" to open the Pivot Editor for the "Successful Privileged Authentications" object.
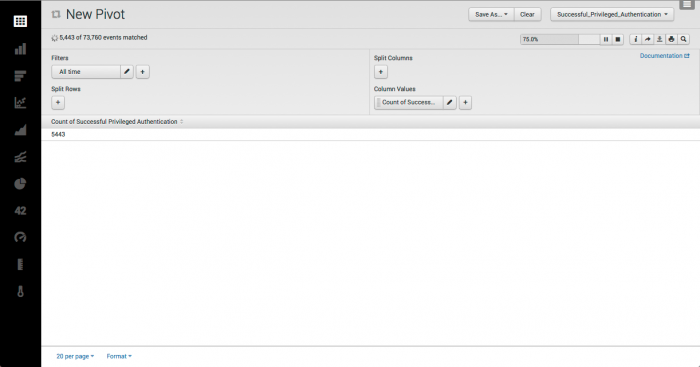
4. By default, the Pivot Editor displays a table visualization with two elements defined:
- A time range Filter element set to All time.
- A Column Values element set to "Count of Successful Privileged Authentications".
See "Add pivot elements" in the Pivot Tutorial for more information about pivot elements.
Currently your Pivot table shows a single value, the total count of Successful Privileged Authentication over All time.
Let's make a few simple changes to make this information more interesting.
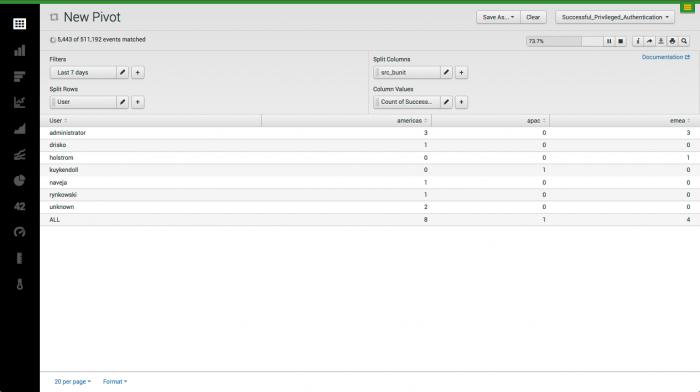
1. Change the time range filter to the last 7 days.
2. Split the the rows by user and rename this column "User".
3. Split the rows by source business unit and count of successful authentications.
Now the data is beginning to look a bit more useful, but there are many more improvements that you can make.
See "Design pivot tables with the Pivot Editor" and "Design pivot charts and visualizations with the Pivot Editor" in the Pivot Manual, part of the core Splunk documentation.
After you define a pivot, you can save it as either a report or a dashboard panel.
Save as a report
To save the pivot as a report:
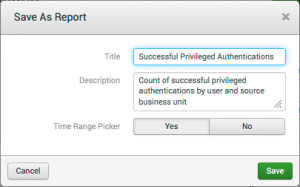
1. Click Save As... and select Report.
2. Enter a title for the report: "Successful Privileged Authentications" and a description (optional).
3. . Select Yes to include the time range picker. (This should be the default.)
4. Click Save.
A report created from Pivot will always be saved under the current app and owner namespace.
You can view and edit all reports from the app navigation bar, under Reports. To find the Reports list, click on the green slider to open the app navigation bar.
For more information about creating reports from Pivot see "Save a search or pivot as a report" and in the core Splunk documentation.
Save as a dashboard
To save the pivot as a dashboard:
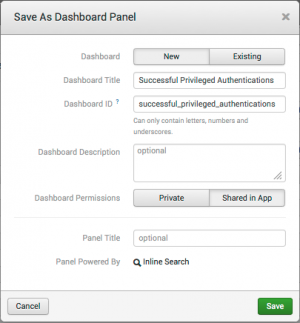
1. Click Save As... and select Dashboard Panel.
2. Enter a title for the dashboard: "Successful Privileged Authentications" and a description (optional).
3. . Select Shared in app to share this dashboard in the app. (Private is the default.)
4. Click Save.
See "Design pivot tables with the Pivot Editor" for information about building dashboards with data models and Pivot.
Use tstats to create searches
You can search data models using the tstats command. Note that the raw data is still searchable without the data model, but using this command to search through data models enables you to take advantage of the data structure and acceleration.
Accelerating data models
You accelerate a data model to speed up the data set represented by that data model for reporting purposes. After a data model is accelerated, pivots, reports, and dashboard panels that use that data model should complete faster than they did before. See "Enable data model acceleration" in the core Splunk documentation for more information about accelerating data models.
The Splunk_SA-CIM ships with data model acceleration turned off. To accelerate a data model, in Splunk Web go to Settings > Data models > Manage data models and click the lightning bolt button next to the data model.
Note: Apps using data models (for example, Enterprise Security) will automatically enable acceleration during installation.
Auditing data model acceleration
The datamodelinfo command displays information pertaining to data models and data model acceleration jobs. This command can be used on an ad-hoc basis if you need additional information about acceleration.
The "datamodel_audit" view represents this information graphically, and can be used to understand more about the status of data model acceleration.
Additional add-ons
In addition to installing the Splunk_SA_CIM add-on, you might need to install additional add-ons to understand specific domains of data or to extend the information available in a CIM datamodel.
Some fields in the Common Information Model will not populate with data unless the SA-IdentityManagement add-on is present in your deployment (contained in Splunk App for Enterprise Security and Splunk App for PCI Compliance). These fields need to have SA-IdentityManagement installed in order to collect data:
category
bunit
should_update
should_timesync
requires_av
If SA-IdentityManagement is not installed in the environment, these fields may not contain data.
| Use the Common Information Model | FAQ |
This documentation applies to the following versions of Splunk® Common Information Model Add-on: 3.0, 3.0.1, 3.0.2


 Download manual
Feedback submitted, thanks!