Use the Content Pack for Microsoft Exchange
Once you install the Content Pack for Microsoft Exchange, and configure the Splunk Add-on for Microsoft Exchange to collect data, you can use the content pack to proactively monitor and troubleshoot your Microsoft Exchange environment.
Dashboards overview
The Content Pack for Microsoft Exchange includes 48 dashboards that provide visibility into the different layers of your Microsoft Exchange services. The Glass Tables are comprised of distinct sections geared towards different audiences. The Service Analyzer provides visibility into the performance of your entire email service, and an Entity Health page displays vital metrics for individual Microsoft Exchange entities.
For descriptions of all the available dashboards, see the Dashboard reference for the Content Pack for Microsoft Exchange.
Monitor your overall Microsoft Exchange environment
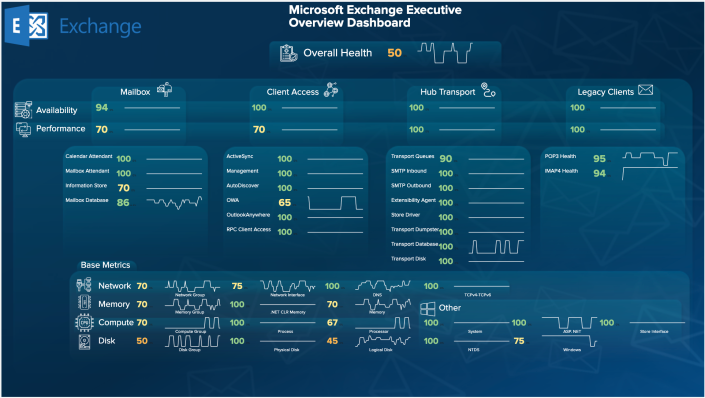
This content pack includes several preconfigured Glass Tables. Glass Tables give you a real-time overview of what's going on in your Microsoft Exchange environment and offer overall health scores for your Microsoft Exchange environment.
The following Glass Tables are included in the content pack:
| Glass Table name | Description |
|---|---|
| Exchange & 365 Glass Table [Executive Overview in Exchange] | This combined executive overview contains executive-level metrics for Microsoft 365 and Microsoft Exchange. It enables your IT Operations team to drill down into the individual services in each area. If you see an abnormal service health score, click the service to open and investigate it in the Service Analyzer. Note, you have to install the Splunk Add-on for Microsoft 365 for this glass table to display Microsoft 365 data. See Install and configure the Content Pack for Microsoft 365. |
| Exchange Executive Overview |
The executive view contains executive-level metrics to illustrate the service level you're delivering. Displays the availability and performance of the four major areas of Microsoft Exchange: Mailbox, Client Access, Hub Transport, and Legacy Clients. The Glass Table also displays base metrics such as network, memory, processing, and disk. The table breaks out the four major areas of the executive view to enable your IT Operations team to drill down into the individual services in each area. If you see an abnormal service health score, click the service to open and investigate it in the Service Analyzer. |
| Exchange Functional Overview | The functional view provides full visibility across four key components of your Microsoft Exchange service: Mailbox, Client Access, Hub Transport, and Legacy Clients, enabling you to proactively communicate about activities and events that impact customer experience. The Glass Table also displays base metrics such as network, memory, processing, and disk. |
| Exchange System Overview | The system view provides visibility of top-level service health, as well as sub-level services and base metrics, enabling you to remediate outages or investigate low service health scores. |
Monitor Microsoft Exchange services
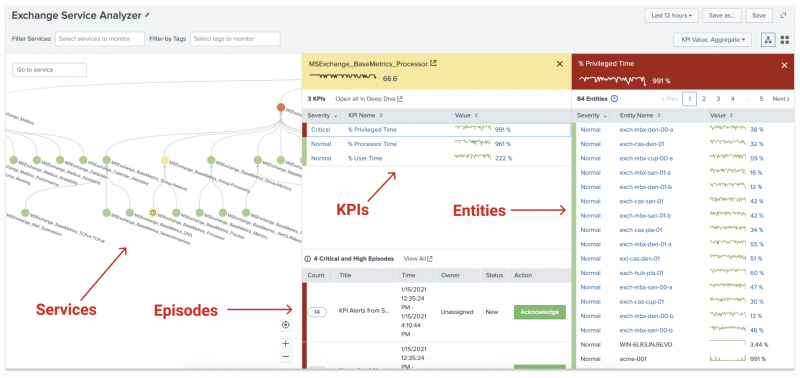
The Exchange Service Analyzer included in the content pack provides instant, real-time visibility into the health of your entire email service and all its components, with granular composite health scores across the entire service path. Detect service anomalies faster with visibility into the health of each one of the 64 service components that affect your overall email performance including Outlook RPC, OWA, Active Sync, Transport, and SMTP.
To access the custom Service Analyzer view, perform the following steps:
- From the ITSI main menu, click Service Analyzer > Analyzers.
- Select Exchange Service Analyzer from the list of analyzers.
The following image shows a section of the Exchange Service Analyzer with the Processor Base Metric service selected. Select any service to drill down into its KPIs and entities. Any critical or high severity episodes associated with the service are displayed in the side panel. Click View All to view all associated episodes in Episode Review.
Monitor Microsoft Exchange alerts
Some services in the Content Pack for Microsoft Exchange are configured to generate notable events when aggregate KPI threshold values reach specific levels. The default aggregation policy then groups these events into meaningful episodes in Episode Review.
To monitor and investigate all episodes in your Microsoft Exchange environment, navigate to Episode Review. You can drill down into individual episodes to perform more granular root cause analysis, such as viewing the timeline of an event or examining common fields. You can then take specific actions on these episodes such as pinging a host, sending an email, or creating a ticket in ServiceNow or Remedy.
For more information about navigating and using Episode Review, see Overview of Episode Review in ITSI in the Event Analytics Manual.
Monitor Microsoft Exchange entities
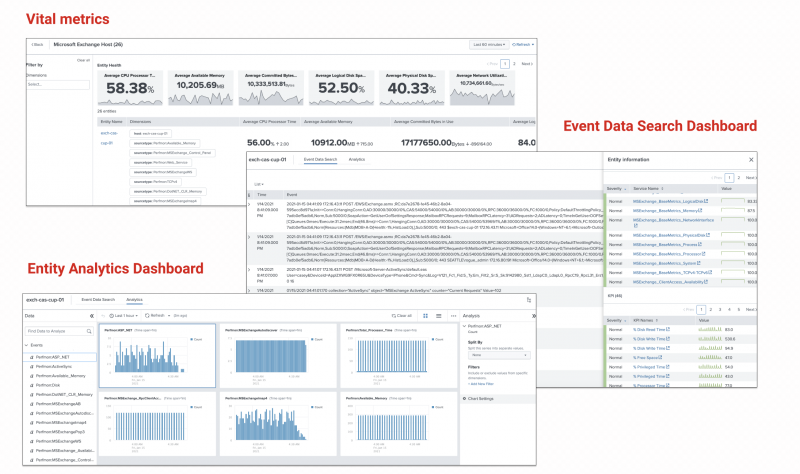
The content pack includes an entity type called Microsoft Exchange Host that groups entities originating from Microsoft Exchange. The entity type contains a set of vital metrics, which are statistical calculations based on Splunk Search Processing Language (SPL) searches that represent the overall health of entities of that type. To view the Entity Health page for the Exchange entity type, perform the following steps:
- From the ITSI main menu, click Infrastructure Overview.
- In the Group by drop-down menu, choose Entity Type.
- Select the Microsoft Exchange Host entity type to drill down into its vital metrics.
For more information about entity types and vital metrics, see Overview of entity types in ITSI in the Entity Integrations Manual.
Vital metrics
Use the following table to view the vital metrics for the Microsoft Exchange Host entity type:
| Vital metric | Description |
|---|---|
| Average CPU Processor Time | Average values from counter "% Processor Time" |
| Average Available Memory | Average values from counter "AvailableMBytes" |
| Average Committed Bytes in Use | Average values from counter "Committed Bytes" |
| Average Logical Disk Space Available | Average values from counter "% Free Space" |
| Average Physical Disk Space Available | Average values from counter "% Free Space" |
| Average Network Utilization | Average values from counter "Bytes Total/sec" |
Entity Dashboards
You can select an individual entity on the Entity Health page to drill down further into its performance metrics and log events. The Event Data Search dashboard displays the most recent log events associated with an entity over the last hour. The Analytics dashboard lets you view the trend of data coming in from each host by source type in a single snapshot.
To learn more about the available entity dashboards, see the following resources:
- To use the Event Data Search, see the Event Data Search dashboard in ITSI.
- To use the Analytics dashboard, see Analyze entity performance metrics in ITSI.
The following image shows the vital metrics and dashboards included in the content pack:
Microsoft Exchange dashboards
To access the dashboards that come with this content pack, follow these steps:
- From the IT Service Intelligence or IT Essentials Work main navigation bar, select Dashboards > Dashboards.
- Use the filter field to limit the list view to the dashboards for this content pack. Dashboards with the App name of DA-ITSI-CP-microsoft-exchange belong to the Content Pack for Microsoft Exchange.
- On the resulting list of Dashboards, select any dashboard listed to take edit actions and change sharing settings.
The following Microsoft Exchange dashboards are available:
| Category (Feature) | Dashboards |
|---|---|
| Administrative Reports | Administrator Audit, Anomalous Logons, Internal Spammers, Litigation Hold, Multi-Mailbox Search Usage, Non-Owner Mailbox Access |
| Exchange Overview | Host Overview, Client Activity, Performance Overview, Capacity, Message Volume (Last 4 Hours), Messages Per Second (Last 4 Hours), Message Volume With Shadow Message (Last 4 Hours), Messages Per Second With Shadow Message (Last 4 Hours), Exchange Queue Length (Last 4 Hours) |
| Hosts and Mailbox Database | Host Overview, Analyze a Host, Analyze a Host Drive, Mailbox Database Overview, Analyze a Mailbox Database, Clustering and Replication, Windows Update and Host Downtime |
| Message Activity | Message Activity Overview, Track a Message, Inbound Messages, Outbound Messages, Internal Messages, Message Activity by Username, Message Activity by IP Address, Message Activity by Domain |
| Performance and Throttling | Host Performance Reports, Client Access Servers, Hub Transports, Mailbox Stores, Managed Folder Assistants, Client Throttling Policies |
| User Behavior | User Behavior Overview, Client Service Overview, Analyze a User Mailbox, External Logins Map, Outlook (RPC), Outlook Web Access, ActiveSync, Outlook Anywhere, Exchange Web Series, POP3 and IMAP4 |
| Usage and Capacity Planning | Environment Overview, Mailbox Quota Usage, Message Volume, Public Folder Usage, Top Mailboxes and Folders by Size, Unused Mailboxes, User Counts, and Mailbox Sizes |
For more information on these Dashboards, see Dashboard reference for the Content Pack for Microsoft Exchange.
| Migrate from the Splunk App for Microsoft Exchange to the Content Pack for Microsoft Exchange | Troubleshoot the Content Pack for Microsoft Exchange |
This documentation applies to the following versions of Content Pack for Microsoft Exchange: 1.6.0, 1.6.1, 1.7.0


 Download manual
Feedback submitted, thanks!