View and manage episodes with the Content Pack for ITSI Monitoring and Alerting
Use the Content Pack for ITSI Monitoring and Alerting to see notable alerts and episodes in your data. You can configure the content pack to maximize the value and usability of these alerts and episodes.
Saved episode views
There are four pre-built episode views in the content pack that let you filter down to episodes in a specific lifecycle of the incident process. You can customize these views to meet your organization's needs and workflows and save them as new customized views.
Episodes - New (untriaged). A list of every new episode in the environment. Since an episode moves from New to In Progress when it is acknowledged by analyst, this view shows "untouched" episodes.Episodes - Open. A list of every episode that has not been marked as resolved or closed. This view shows active problems in the environment.Episodes - Adjusted by Episode Monitor. A list of every episode triggered by an Episode Monitoring alert. Episodes with an Episode Monitoring alert are elevated in status and importance, as the alert indicates that the episode exhibits concerning behavior and that an alert action has been taken on the episode.Episodes - All. This is an unfiltered list of all episodes.
Episode timeline event type configuration
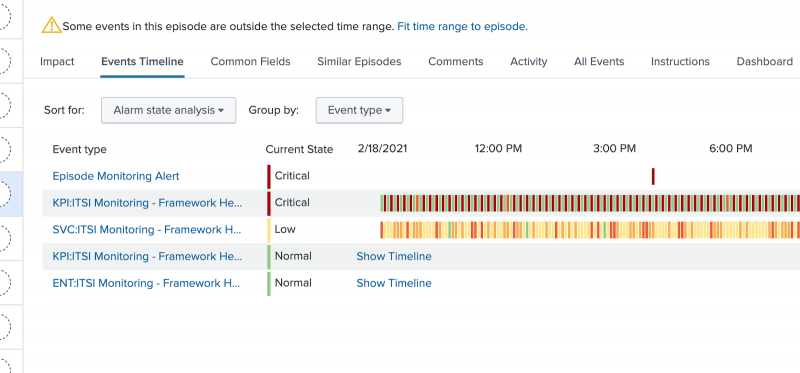
The episode Events Timeline tab provides a correlated view of all notable events associated with the episode over time.
The Event Type column allows you to logically separate different types of notable events so they can be presented in their own "swim lane". Typically, each swim lane represents an alarm, which can change severity over time, hopefully clearing (turning green) when the original alarm condition is no longer active. The content pack allows you to customize Event Types. The default implementation is as follows:
- Notable events associated with degraded service health scores appear in the swim lane "SCV: Service Name".
- Notable events associated with degraded KPI aggregate values appear in the swim lane "KPI: Service Name - KPI Name".
- Notable events associated with degraded entities appear in the swim lane "ENT: Service Name - KPI Name".
- Notable events from the Universal Correlation Search are grouped as alarms, appearing in swim lanes like this: "ALARM: signature : src : subcomponent".
To customize the default implementation for the first three items, modify the macro add_itsi_service_monitoring_ne_identifier_string to update the value of the groupingid field. Within an Episode, all Notable Events with the same value of groupingid will appear in the same swim lane. To customize the default implementation for fourth item, create a field called groupingid in the events that qualify for the Universal Correlation Search, and the value of that field is used in the Events Timeline.
Drilldown configuration
Within the All Events tab of the episode you have the ability to drill down from a notable event to further investigate the incident. The content pack provides a default implementation for notable event drill downs which you can customizes. The default implementation is as follows:
- Notable events associated with a degraded service health score will drill to the service analyzer with focus on the service.
- Notable events associated with a degraded aggregate KPI will drill to the service analyzer with focus on the KPI.
- Notable events associated with a degraded pseudo-entity will drill to the service analyzer with focus on the KPI.
- Notable events associated with a degraded entity will drill to the entity detail page.
- Notable events from the Universal Correlation Search have a "Drilldown Search", but no default "Drilldown Link" action.
To customize the default implementations, modify the macro add_itsi_service_monitoring_drilldowns and change the value of itsiDrilldownURI. To customize drilldowns and other aspects of external alerts using Universal Alerting, including itsiDrilldownURI, see Normalize an external alert source to use Universal Alerting.
Other episode options
Episode title, severity, and other configuration options are controlled by Notable Event Aggregation Policies. The configurations can be modified, but it's a best practice to keep these configurations unchanged. For more details about the policies included in this content pack, see About the Aggregation Policies in the Content Pack for ITSI Monitoring and Alerting.
| Configure alerts in the Content Pack for ITSI Monitoring and Alerting | Troubleshoot the Content Pack for ITSI Monitoring and Alerting |
This documentation applies to the following versions of Content Pack for ITSI Monitoring and Alerting: 2.0.2, 2.0.3

 Download manual
Feedback submitted, thanks!