Install and configure the Content Pack for Splunk Observability Cloud
Follow these high-level steps to configure the Content Pack for Splunk Observability Cloud`:
- Install and configure the Splunk Infrastructure Monitoring and Splunk Synthetic Monitoring Add-ons. Note, these add-ons have to be installed on search heads in a distributed deployment.
- Create modular inputs for Splunk Infrastructure Monitoring and Splunk Application Performance Monitoring.
- Install the Content Pack for Splunk Observability Cloud.
- Enable your Splunk Observability Cloud entity searches.
- Configure KPI thresholds.
- (Optional) Configure navigation suggestions for custom subdomains.
Prerequisites
- Create a full backup of your ITSI environment in case you need to uninstall the content pack later. For more information, see Create a full backup in the Administration Manual.
- If you have either the Content Pack for Splunk Synthetic Monitoring or the Content Pack for Splunk Infrastructure Monitoring installed, before installing the Content Pack for Splunk Observability Cloud, you need to follow the steps to migrate from these content packs to the Content Pack for Splunk Observability Cloud. See the Migrate from the Content Pack for Splunk Synthetic Monitoring to the Content Pack for Splunk Observability Cloud and Migrate from the Content Pack for Splunk Infrastructure Monitoring to the Content Pack for Splunk Observability Cloud topics for migration steps.
Install and configure the Splunk Infrastructure Monitoring and Splunk Synthetic Monitoring Add-ons
This content pack depends on data collected in the Splunk Infrastructure Monitoring Add-on and the Splunk Synthetic Monitoring Add-on. You can safely install add-ons on all tiers of a distributed Splunk platform deployment, including heavy forwarders, indexers, or search heads. Note, these add-ons have to be installed on search heads in a distributed deployment. Download the latest versions of the Splunk Synthetic Monitoring Add-on and the Splunk Infrastructure Monitoring Add-on from Splunkbase.
Create or clone sample modular inputs for Splunk Infrastructure Monitoring and Splunk Application Performance Monitoring
After you have configured the Splunk Infrastructure Monitoring and Splunk Synthetic Monitoring Add-ons, you need to create or clone sample modular inputs for the data for this content pack.
Clone sample inputs
The Splunk Infrastructure Monitoring Add-on includes the following sample modular input queries for use with this content pack. See Sample programs in the Splunk® Infrastructure Monitoring Add-on manual for steps to clone these sample inputs.
- SAMPLE_AWS_EC2 input stream
- SAMPLE_AWS_Lambda input stream
- SAMPLE_Azure input stream
- SAMPLE_Containers input stream
- SAMPLE_GCP input stream
- SAMPLE_Kubernetes input stream
- SAMPLE_OS_Hosts input stream
Create APM inputs
Inputs for APM have to be manually created. Follow these steps to create a modular input for each APM data input you want to set up:
- Go to Settings > Data inputs.
- Locate the Splunk Infrastructure Monitoring Data Streams.
- Select +Add new.
- Enter a name for the input. Avoid using "SAMPLE_" in the program name. Programs with a "SAMPLE_" prefix won't run unless manually enabled.
- Enter an Organization ID. This is the ID of the organization used to authenticate and fetch data from Splunk Infrastructure Monitoring. You can find your Organization ID on the Account Settings page in Splunk Observability Cloud or the Configuration page in the Splunk Infrastructure Monitoring Add-on.
- In the SignalFlow Program field, enter modular input query from the list of modular input queries that follows these steps.
- Adjust the Metric Resolution and Additional Metadata Flag for your needs.
- Set Interval to 300.
- Set sourcetype to Manual.
- Enter stash for Source type.
- Enter $decideOnStartup for Host.
- Select sim_metrics for Index.
Repeat these steps for each data input you want to set up.
Modular input queries
Splunk Application Performance Monitoring (APM) Errors
"error_durations_p99 = data('service.request' + '.duration.ns.' + 'p99', filter=filter('sf_environment', '*') and filter('sf_service', '*') and filter('sf_error','*') and not filter('sf_dimensionalized', '*') and filter('sf_error', 'true'), rollup='max').mean(by=['sf_service', 'sf_environment', 'sf_error'], allow_missing=['sf_httpMethod']).publish(label='error_durations_p99') | non_error_durations_p99 = data('service.request' + '.duration.ns.' + 'p99', filter=filter('sf_environment', '*') and filter('sf_service', '*') and filter('sf_error','*') and not filter('sf_dimensionalized', '*') and filter('sf_error', 'false'), rollup='max').mean(by=['sf_service', 'sf_environment', 'sf_error'], allow_missing=['sf_httpMethod']).publish(label='non_error_durations_p99') | error_durations = data('service.request' + '.duration.ns.' + 'median', filter=filter('sf_environment', '*') and filter('sf_service', '*') and filter('sf_error','*') and not filter('sf_dimensionalized', '*') and filter('sf_error', 'true'), rollup='max').mean(by=['sf_service', 'sf_environment', 'sf_error'], allow_missing=['sf_httpMethod']).publish(label='error_durations') | non_error_durations = data('service.request' + '.duration.ns.' + 'median', filter=filter('sf_environment', '*') and filter('sf_service', '*') and filter('sf_error','*') and not filter('sf_dimensionalized', '*') and filter('sf_error', 'false'), rollup='max').mean(by=['sf_service', 'sf_environment', 'sf_error'], allow_missing=['sf_httpMethod']).publish(label='non_error_durations') | error_counts = data('service.request' + '.count', filter=filter('sf_environment', '*') and filter('sf_service', '*') and filter('sf_error','*') and not filter('sf_dimensionalized', '*') and filter('sf_error', 'true'), rollup='sum').sum(by=['sf_service', 'sf_environment', 'sf_error'], allow_missing=['sf_httpMethod']).publish(label='error_counts') | non_error_counts = data('service.request' + '.count', filter=filter('sf_environment', '*') and filter('sf_service', '*') and filter('sf_error','*') and not filter('sf_dimensionalized', '*') and filter('sf_error', 'false'), rollup='sum').sum(by=['sf_service', 'sf_environment', 'sf_error'], allow_missing=['sf_httpMethod']).publish(label='non_error_counts')"
Splunk Application Performance Monitoring (APM) Rate (Throughput)
"thruput_avg_rate = data('service.request.count', filter=filter('sf_environment', '*') and filter('sf_service', '*') and (not filter('sf_dimensionalized', '*')), rollup='rate').sum(by=['sf_service', 'sf_environment']).publish(label='thruput_avg_rate')"
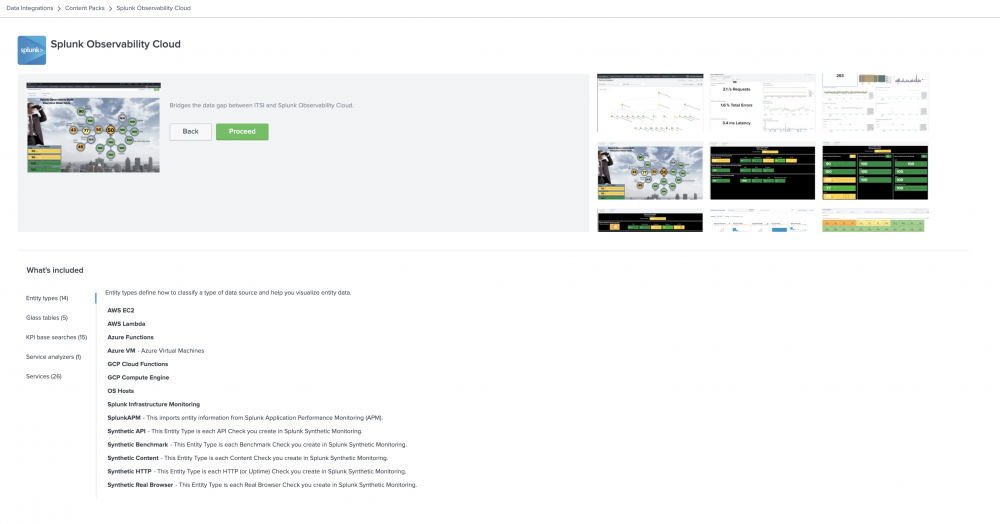
Install the Content Pack for Splunk Observability Cloud
The Content Pack for Splunk Observability Cloud is automatically available for installation once you have installed the Splunk App for Content Packs on the search head with ITSI 4.9.4 or 4.11.x or higher or IT Essentials Work 4.9.4 or 4.11x. or higher. For steps to install the Splunk App for Content Packs, see Install the Splunk App for Content Packs. After you install the Splunk App for Content Packs, you can follow these steps install the content pack:
- From the ITSI main menu, click Configuration > Data Integrations.
- Select Add content packs or Add structure to your data depending on your version of ITSI or ITE Work.
- Select the Splunk Observability Cloud content pack.
- Review what's included in the content pack and then click Proceed.
- Configure the settings:
- Choose which objects to install: For a first-time installation, select the items you want to install and deselect any you're not interested in. For an upgrade, the installer identifies which objects from the content pack are new and which ones already exist in your environment from a previous installation. You can selectively choose which objects to install from the new version or install all objects.
- Choose a conflict resolution rule for the objects you install: For upgrades or subsequent installs, decide what happens to duplicate objects introduced from the content pack. Choose from these options:
- Install as new: Any existing identical objects in your environment remain intact.
- Replace existing: Existing identical objects are replaced with those from the new installation. Any changes you previously made to these objects are overwritten.
- Import as enabled: Select whether to install objects as enabled or leave them in their original state. We recommend that you import objects as disabled to ensure your environment doesn't break from the addition of new content. This setting only applies to services, correlation searches, and aggregation policies. All other objects such as KPI base searches and saved searches are installed in their original state regardless of the option you choose.
- Add a prefix to your new objects: Optionally, append a custom prefix to each object installed from the content pack. For example, you might prefix your objects with
CP-to indicate they came from a content pack. This option can help you locate and manage the objects after installation. - Backfill service KPIs: Optionally backfill your ITSI environment with the previous seven days of KPI data. Consider enabling backfill if you want to configure adaptive thresholding and predictive analytics for the new services. This setting only applies to KPIs, not service health scores.
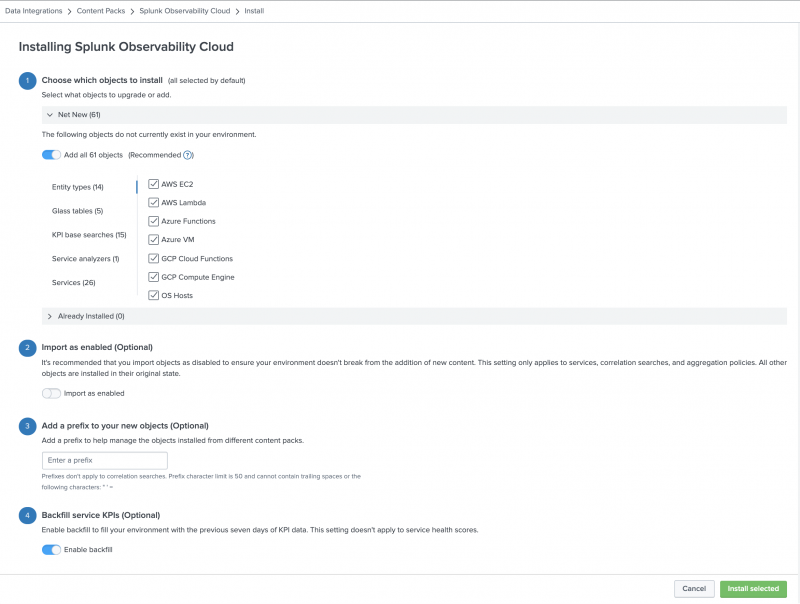
- When you've made your selections, click Install selected.
- Click Install to confirm the installation. When the installation completes you can view all objects that were installed in your environment. A green checkmark on the Data Integrations page indicates which content packs you've already installed.


Enable your Splunk Observability Cloud entity searches
There are nine entity discovery searches included with this content pack. They are disabled by default. When you ready to get your data in, follow these steps to enable the entity discover searches for Splunk Observability Cloud.
- In Splunk Enterprise go to Settings > Searches, reports, and alerts.
- In the Type dropdown, select All.
- In the App dropdown, select Splunk Observability Cloud (DA-ITSI-CP-splunk-observability).
- In the Owner dropdown, select All.
- Depending on the searches you selected to install, these entity discovery searches are available to enable:
ITSI Import Objects - Get_OS_HostsITSI Import Objects - Get_SIM_AWS_EC2ITSI Import Objects - Get_SIM_AWS_LambdasITSI Import Objects - Get_SIM_Azure_FunctionsITSI Import Objects - Get_SIM_Azure_VMITSI Import Objects - Get_SIM_GCP_ComputeITSI Import Objects - Get_SIM_GCP_FunctionsITSI Import Objects - Get_SSM_EntitiesITSI Import Objects - Splunk-APM Application Entity Search
- Select Edit > Enable for each search you want to enable.
When you've finished enabling the entity searches to import your entities, go to the Service Analyzer > Default Analyzer to see your services and KPIs light up.
Content pack objects are disabled by default on import. If you didn't toggle the option to import the content pack objects as enabled you have to enable them under Configuration > Services. Once you have enabled the services the Service Analyzer will light up.
Configure KPI thresholds
Some KPIs in this content pack have predetermined aggregate and per-entity thresholds configured. Go through the KPIs in each service and configure the aggregate and per-entity thresholds values to reasonable defaults based on your use case. For steps to configure KPI thresholds, see Configure KPI thresholds in ITSI in the Service Insights manual.
For a full list of the KPIs in this content pack, see the KPI reference for the Content Pack for Splunk Observability Cloud.
KPI alerting
Because acceptable application performance varies widely per use case, KPI alerting isn't enabled by default in this content pack. To receive alerts for KPIs when aggregate KPI threshold values change, see Receive alerts when KPI severity changes in ITSI. ITSI generates notable events on the Episode Review page based on the alerting rules you configure.
If your Observability Cloud instance uses a custom subdomain, the navigation suggestion links for the SplunkAPM and Splunk Infrastructure Monitoring entity types have to be updated with your custom subdomain. Follow these steps for both the SplunkAPM and Splunk Infrastructure Monitoring entity types.
- Go to Configuration > Entities from the ITSI menu.
- Go to the Entity Types tab.
- Follow these steps to update the navigation suggestions for both the SplunkAPM and Splunk Infrastructure Monitoring entity types.
- Edit the entity type.
- Expand the Navigations section.
- Edit the navigation.
- Change the
app.{sf_realm}.signalfx.comportion of the URL to{custom-subdomain}.signalfx.com. - Click Save navigation.
- Repeat these steps for each navigation.
- Select Save to save the entity type when you are finished update each navigation.
Next steps
Now that you have installed and configured the Content Pack for Splunk Observability Cloud, you can start using the dashboards and visualizations in the content pack to monitor your web applications. For instructions for using the content pack, see Use the Content Pack for Splunk Observability Cloud.
| Release notes for the Content Pack for Splunk Observability Cloud | Use the Content Pack for Splunk Observability Cloud |
This documentation applies to the following versions of Content Pack for Splunk Observability Cloud: 1.0.0
Feedback submitted, thanks!