Use the Content Pack for Monitoring Phantom as a Service
After you complete the configuration steps described in Configure the Content Pack for Monitoring Phantom as a Service, you're ready to leverage the following objects included with the content pack:
Service Analyzer
After you set up your Phantom services, you can begin to monitor the health of your Phantom environment in the ITSI Service Analyzer. The Service Analyzer is the home page for ITSI and serves as your starting point for monitoring your services. Once you install the Content Pack for Monitoring Phantom as a Service, your Phantom services automatically appear on the Service Analyzer.
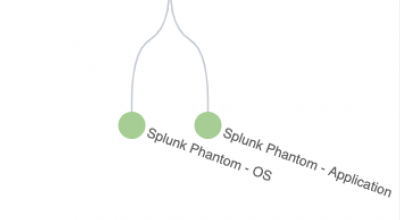
You can create a custom saved service analyzer view specifically filtered to your Phantom services. This functionality is especially important if you're monitoring other parts of your Splunk Enterprise environment in ITSI. The following image is an example of how the Phantom services look like when grouped together in the Service Analyzer tree view:
For more information about the Service Analyzer, see Overview of the Service Analyzer in ITSI.
Deep dives
Deep dives are an investigative tool to help you identify and analyze issues in your IT environment. View KPI search results over time, zoom in on KPI search results, and visually correlate root cause. For more information about deep dives, see Overview of deep dives in ITSI.
The Content Pack for Monitoring Phantom as a Service contains the following preconfigured deep dives:
Splunk Phantom - OSto monitor your Phantom OS service and its corresponding KPIs.Splunk Phantom - Applicationto view the Phantom application service and its corresponding KPIs.
To view the deep dives, click Deep Dives from the ITSI main menu.
Seeing No data on any of the error-based event lanes in a deep dive means there are no errors. If errors do occur, click the Events lane to see log events at that time.
| Install and configure the Content Pack for Monitoring Phantom as a Service |
This documentation applies to the following versions of Content Pack for Monitoring Phantom as a Service: 1.0.1

 Download manual
Feedback submitted, thanks!