Configure the Content Pack for Unix and Dashboards and Reports
After you install the Content Pack for Unix Dashboards and Reports, you can configure the data and scripted inputs using the Settings - Unix dashboard. Perform the following steps to open that dashboard:
- In Splunk Web, open ITSI or IT Essentials Work.
- From the navigation bar, choose Dashboards > Dashboards.
- Open the Settings - Unix dashboard. The App name for this dashboard is DA-ITSI-CP-unix-dashboards.
From this dashboard you can change settings on the following pages: Your Data, Categories, and Alerts.
Configure Your Data
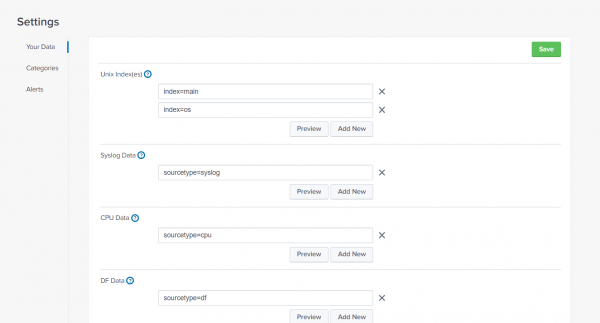
Configure fields on the Your Data page to input which indexes contain the data that the content pack uses, and specify or change the data sources for the content pack.
You can easily add, remove, and preview fields on the page:
- Use the Add New button to specify additional indexes or source types.
- Enter index=<index name>, where <index name> is an existing index defined on the Splunk instance that hosts the content pack, and which contains data collected by either the Splunk app or add-on for Unix and Linux.
- Enter sourcetype=<sourcetype>, where <sourcetype> is an existing source type defined on the Splunk instance that hosts the content pack.
- Use the X button to remove any indexes or source types.
- Click Preview to confirm that the indexes and source types you've specified contain the *nix data you want the content pack to use. Preview opens a new Search page that displays the most recent events collected for the specified indexes.
The Your Data page includes the following fields:
| Field name | Description | Example |
|---|---|---|
| Unix Index(es) | Field allows you to specify the index(es) that the content pack uses for access to *nix data it has collected. Enter index=<index name>, where <index name> is an existing index defined on the Splunk instance that hosts the content pack.
|
index=os |
| Syslog Data | The sourcetype or sourcetypes for your *nix syslog data, which contains system messages and logs. | sourcetype=syslog |
| CPU Data | The sourcetype or sourcetypes for your *nix cpu data, which contains information on CPU activity. | sourcetype=cpu |
| DF Data | The sourcetype or sourcetypes for your *nix df data, which contains information on disk capacity. | sourcetype=df |
| Hardware Data | The sourcetype or sourcetypes for your *nix hardware data, which contains information on physical hardware. | sourcetype=hardware |
| Interfaces Data | The sourcetype or sourcetypes for your *nix interfaces data, which contains information on network interface utilization. | sourcetype=interfaces |
| Iostat Data | The sourcetype or sourcetypes for your *nix iostat data, which contains information on disk input/ output utilization. | sourcetype=iostat |
| Lastlog Data | The sourcetype or sourcetypes for your *nix lastlog data, which contains information user's last logins. | sourcetype=lastlog |
| LSOF Data | The sourcetype or sourcetypes for your *nix lsof data, which contains information on open files. | sourcetype=lsof |
| Memory Data | The sourcetype or sourcetypes for your *nix memory data, which contains information on memory utilization. | sourcetype=vmstat |
| Netstat Data | The sourcetype or sourcetypes for your *nix netstat data, which contains information on network connections. | sourcetype=netstat |
| Open Ports Data | The sourcetype or sourcetypes for your *nix open ports data, which contains information on open network ports. | sourcetype=openPorts |
| Package Data | The sourcetype or sourcetypes for your *nix package data, which contains information on installed software packages. | sourcetype=package |
| Process Data | The sourcetype or sourcetypes for your *nix process data, which contains information on running processes. | sourcetype=ps |
| Rlog Data | The sourcetype or sourcetypes for your *nix rlog data, which contains information on remote logins. | sourcetype=rlog |
| Time Data | The sourcetype or sourcetypes for your *nix time data, which contains information on time settings. | sourcetype=time |
| Top Data | The sourcetype or sourcetypes for your *nix top data, which contains information on tasks. | sourcetype=top |
| Users With Login Privs Data | The sourcetype or sourcetypes for your *nix users with login privileges data, which contains information on users that have login privileges. | sourcetype=usersWithLoginPrivs |
| Who Data | The sourcetype or sourcetypes for your *nix who data, which contains information on logged in users. | sourcetype=who |
Define Categories and Groups
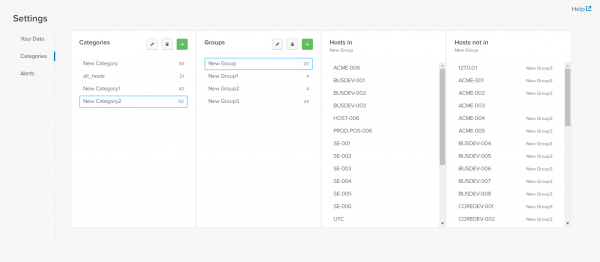
On the Categories page you can define categories and groups for the hosts that the content pack has collected data for. Categories and groups allow you to compare metrics across different host types and/or roles when troubleshooting an issue, and can help you manage a large number of hosts.
About categories and groups
When you first run the Content Pack for Unix Dashboards and Reports, the content pack searches through the OS index for host entries, creates a special category called all_hosts, and creates a special group called Default. The 50 most recent hosts the search finds become a member of this special category and group until you define additional categories and groups.
When you make changes to categories and groups on the Categories page, the content pack writes those changes to $SPLUNK_HOME/etc/apps/splunk_app_for_nix/lookups/dropdowns.csv.
If the content pack can't find any hosts, it creates a default 'all_hosts' group and 'Default' group and sets the host value to *, which the app treats as a wildcard. If you want to create your own categories and groups, you must delete this default category and group first.
Categories page panels
The Categories page includes the following panels:
| Panel name | Description |
|---|---|
| Categories | The first-level grouping mechanism, used to define site locations, like cities or data centers. |
| Groups | The second-level grouping mechanism, used to define host or service groups. |
| Hosts in | Contains hosts that have been assigned to the current Category and Group. The content pack populates this list from the data you have collected with it. |
| Hosts not in | Contains hosts that haven't been assigned to the current Category and Group. The content pack populates this list from the data you have collected with it. |
Add or remove categories and groups
To add categories, click the + to create a category called New Category. Rename the category as appropriate.
To add groups, select the category you want to add the group to, then click the + sign.
You must add at least one host to a group for the content pack to save the group and the group's parent category. The app doesn't save empty categories or groups.
To remove categories or groups, click Delete Category or Delete Group. If you remove a category that has groups under it, the groups in that category are also removed.
Add or remove hosts from a group
Once you have created the categories and groups you want, you can assign hosts to a group. When you assign a host to group, follow these guidelines:
- You can only assign hosts to a group. The content pack then assigns the hosts to the category that contains the group.
- You can assign hosts to more than one group at a time. However, each group must be a member of a separate category.
- You cannot assign hosts to categories directly.
To assign a host to a group, perform the following steps:
- Click the group that you want to assign hosts to. The Hosts in and Hosts not in columns populate with available hosts that the content pack has collected data for.
New groups will not have hosts in the Hosts in column.
- Locate the host that you want to add to the group in the Hosts not in column. If a host is already a member of another group, the content pack displays that group alongside the host name.
- Click on the host in the Hosts not in column to add a new host to the Hosts in column.
Changes get made to the group based on the following factors:
- If the host is not already a member of another group within the currently selected category, Splunk adds the host to the new group and then immediately saves the change.
- If the host is a member of another group within the currently selected category, the host is removed from the old group, added to the new group, and the changes are saved immediately.
To remove a host from a group, perform the following steps:
- Click the group that you want to remove hosts from. The Hosts in column populates with the hosts that have already been assigned to the group. The Hosts not in column populates with available hosts that the content pack has collected data for.
- Locate the host that you want to remove from the group in the Hosts in column.
- Click on the host. That host is removed from the group and changes are saved immediately.
Configure Alerts
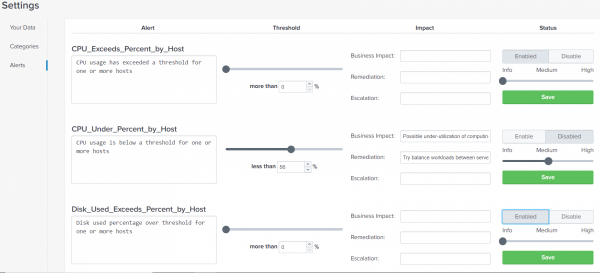
The Content Pack for Unix Dashboards and Reports includes twelve built-in alerts that you can configure. Use the Alerts page to customize the alerts that the content pack displays when certain conditions trigger those alerts.You can add descriptions, change alert thresholds, add business impact, remediation and escalation information, and choose whether or not each alert is active.
Alerts are only configurable by users with admin permissions.
Modify an Alert
To modify an existing Alert, perform the following steps:
- In the Alert section text box, enter a description for the alert in the text box underneath the alert's name.
- In the Threshold section, drag the slider to adjust when the alert triggers. You can also click on the text box underneath the slider and enter the number manually. Valid values for the threshold depend on the alert's base search.
- In the Business Impact text box, enter the impact that the alert represents.
- In the Remediation text box, enter a sentence that describes what a person who encounters this alert can do to stop it.
- In the Escalation text box, enter the name of a person or entity that this alert should be escalated to if attempts to resolve the alert fail or are not made.
- In the Status section, click the Enabled button to enable the alert, or the Disabled button to disable the alert.
- Drag the slider to adjust the alert's severity (Info, Medium, or High). The alert's severity determines where and how it displays on the Alerts page.
- Click Save to save any changes you have made.
Whenever you make a Alert change, the content pack highlights the Save button in green. Any unsaved changes will be lost if you leave the settings page without saving.
Next step
After you install and configure the Content Pack for Unix Dashboards and Reports, you can start using the content pack to monitor and troubleshoot your Linux and Unix operating systems. For further instructions, see, Use the Content Pack for Unix Dashboards and Reports.
| Migrate from the Splunk App for Unix and Linux to the Content Pack for Unix Dashboards and Reports | Use the Content Pack for Unix Dashboards and Reports |
This documentation applies to the following versions of Content Pack for Unix Dashboards and Reports: 1.2.0, 1.3.0


 Download manual
Feedback submitted, thanks!